Essential GA4 Reports You Can Build Right Now
Not sure where to start with Google Analytics (GA4)? Here are templates for the 4 most valuable GA4 reports—including Traffic Acquisition, Landing Page Performance, and User Demographics—that you can build immediately.
Introduction
To learn how to integrate GA4 with Petavue, please follow our Step-by-Step Integration Guide.
Also, don't forget to read our Best Practices & Data Constraints guide. You must understand these to avoid creating empty reports.
All good? Great.
However, you might still be wondering: “What report should I actually create?”
If you haven't done this before or have no prior knowledge of GA4's complex list of dimensions, looking at a blank configuration screen can be overwhelming. To help you hit the ground running, we have compiled the 4 most essential reports.
You can simply start with these configurations directly into your Google Sheet to start analyzing GA4 data on Petavue.
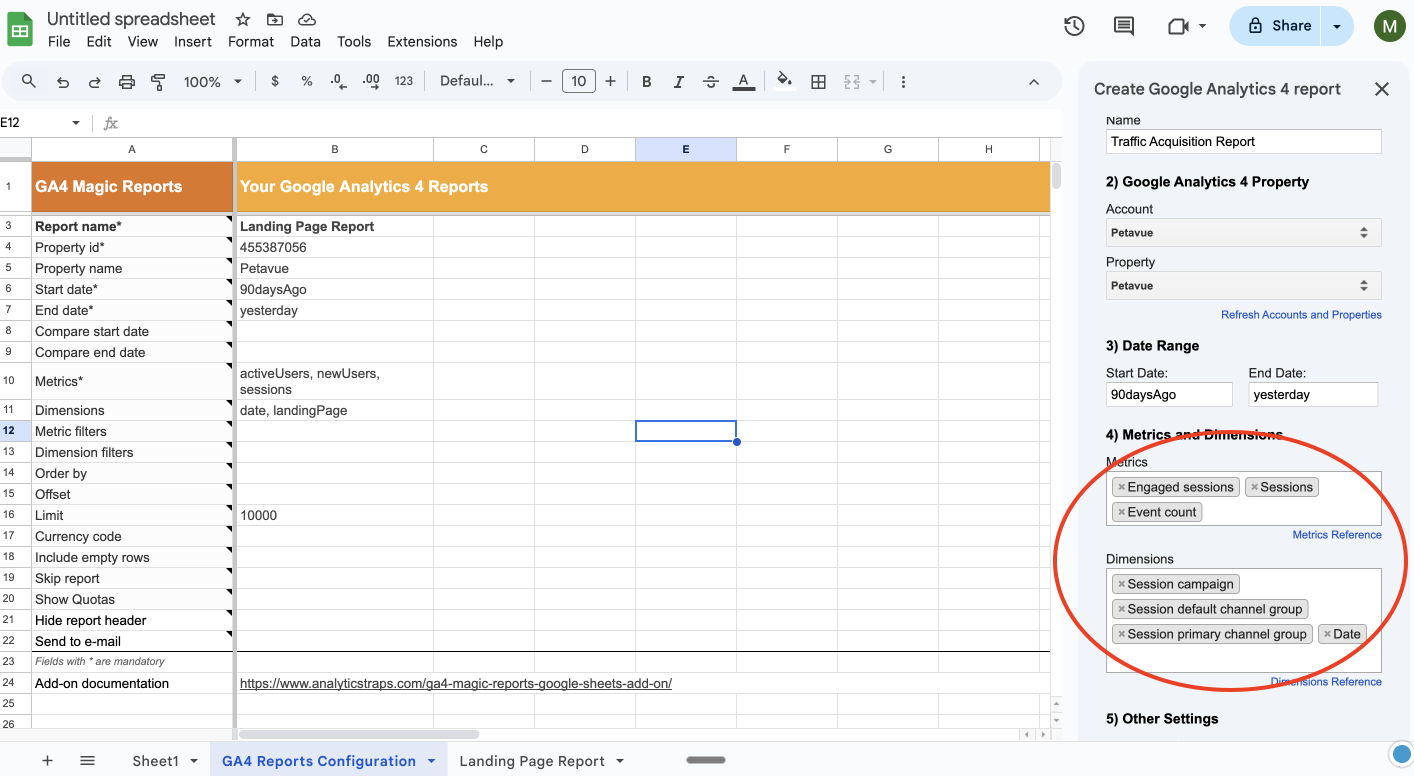
Report 1: Traffic Acquisition
Goal: Understand which marketing channels are driving the most traffic and conversions. This is the best report to stitch with your CRM data in Petavue to see which sources actually lead to closed deals.
Dimensions:
sessionSource(Session Source)sessionMedium(Session Medium)sessionCampaignName(Session Campaign)
Important Note: Remember the green check rule covered in Best Practices & Data Constraints guide. If you drill down too deep (e.g., City + Gender), Google may threshold the data. We recommend keeping this report focused purely on location.
Metrics:
You may add the following relevant metrics for this report:
sessionsactiveUsersconversions(orkeyEvents)totalRevenue
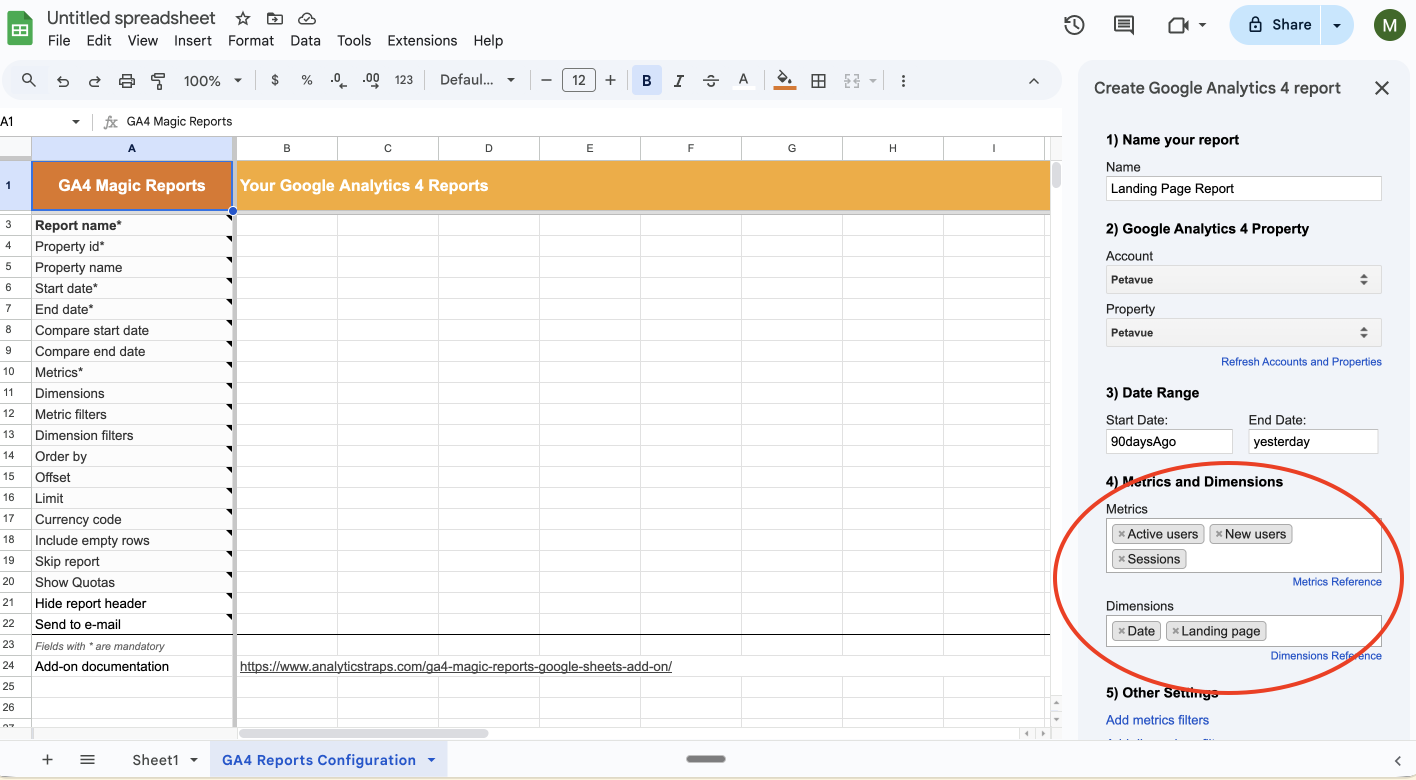
Report 2: Landing Page Performance
Goal: See which pages on your website are the main entry points for your visitors. This helps you identify high-performing content or landing pages that need optimization.
Dimensions:
landingPage(Landing page + query string)
Note: Avoid using "Page title" if your titles change frequently, as it splits the data.
Metrics:
You may add the following relevant metrics for this report:
sessionsactiveUsersengagementRateaverageSessionDuration
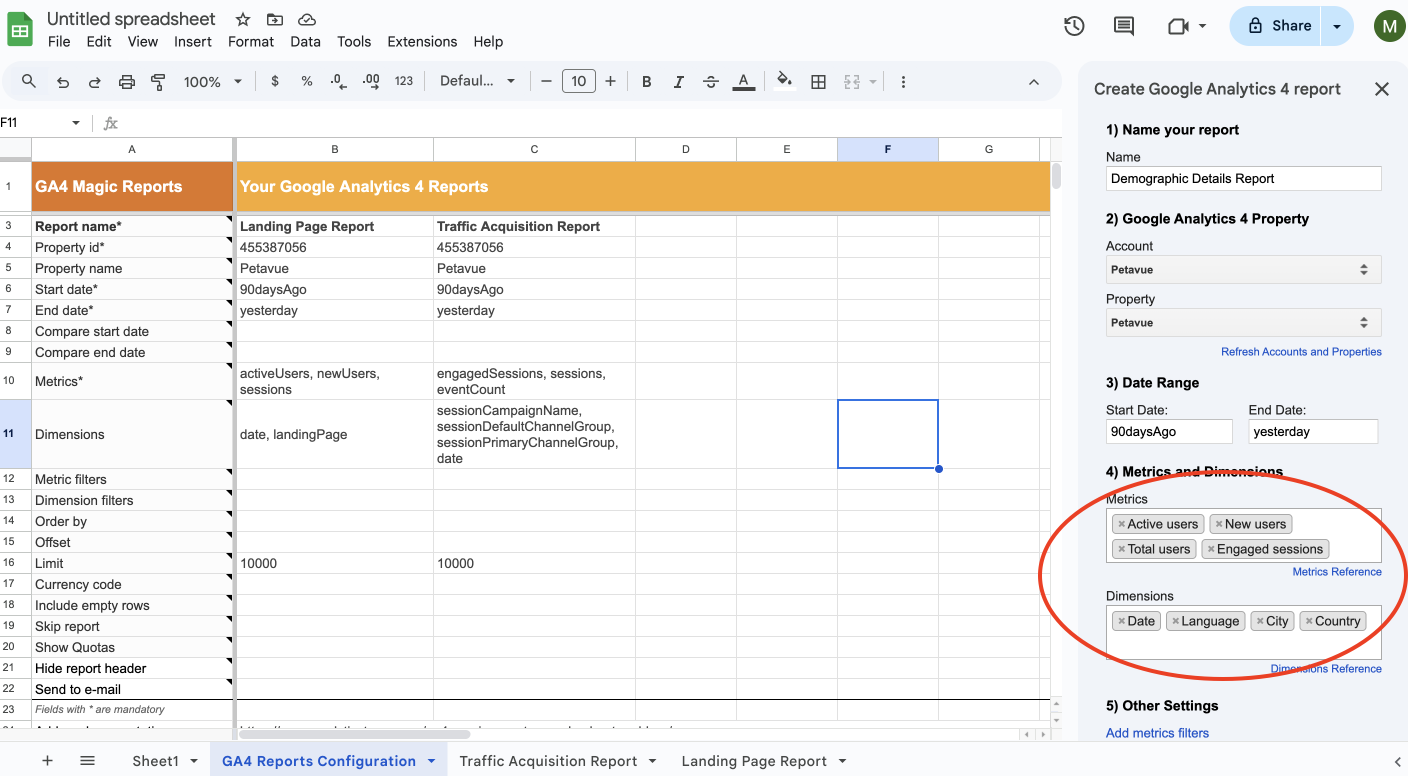
Report 3: Demographics Report
Goal: Analyze where your users are physically located.
Report Name:
- Dimensions:
countryregion(State/Province)city
Metrics:
You may add the following relevant metrics for this report:
activeUserssessions
What to do next?
- Open your Google Sheet and launch the GA4 Magic Reports extension.
- Create a new report for each of the use cases above.
- Run the reports to fetch the data.
- Connect to Petavue: Once the data is in the sheet, share it with support@petavue.com to start analyzing these metrics alongside your other business data.
Need a refresher on how to set this up? Back to the Integration Guide