Understanding GA4 Data Constraints: Best Practices for Building GA4 Reports
Before integrating GA4 with Petavue, it is critical to understand how GA4 limits data exports. This guide explains why you cannot build a single "Master Report" and how to avoid empty data rows.
Introduction: Why you cannot build one "Master Report"
When creating a report using the GA4 Magic Reports extension, you cannot simply select every dimension and metric you want and expect it to work in a single configuration.
GA4 enforces strict rules on how data is combined. If you try to build a single "Master Report" that mixes unrelated data types (for example, combining Demographics like Age/Gender with Traffic Sources like Session Source), two specific failures will occur:
- Data Thresholding: Google will completely withhold the data (returning zeros) to protect user anonymity.
- Metric Inflation: Your user counts will become inaccurate due to how GA4 breaks down user identity at a granular level.
The Solution:
Instead of one large report, you must build multiple, specific reports in the same Google Sheet (e.g., one report strictly for Traffic Sources, another strictly for Demographics).
The following sections explain exactly which combinations cause these issues and how to avoid them.
1. Data Privacy & Restricted Dimensions (Thresholding)
The Issue:
When you try to import dimensions related to Demographics or Search Queries, you may find that your report in Google Sheets returns empty rows or zero values, even though you believe data exists.
Why this happens:
This is caused by a mandatory privacy feature in GA4 called Data Thresholding. Google strictly prohibits the export of data if a report contains sensitive dimensions that could potentially identify individual users.
When does this happen?
This restriction is triggered specifically when you add "sensitive" dimensions to your report. The two most common categories are:
- Demographics: Dimensions such as Age, Gender, and Interests.
- Search Query Information: Data linked from Google Search Console (e.g., the dimension "Organic Google Search query").
The Consequence in Google Sheets:
The API is stricter than the web console.
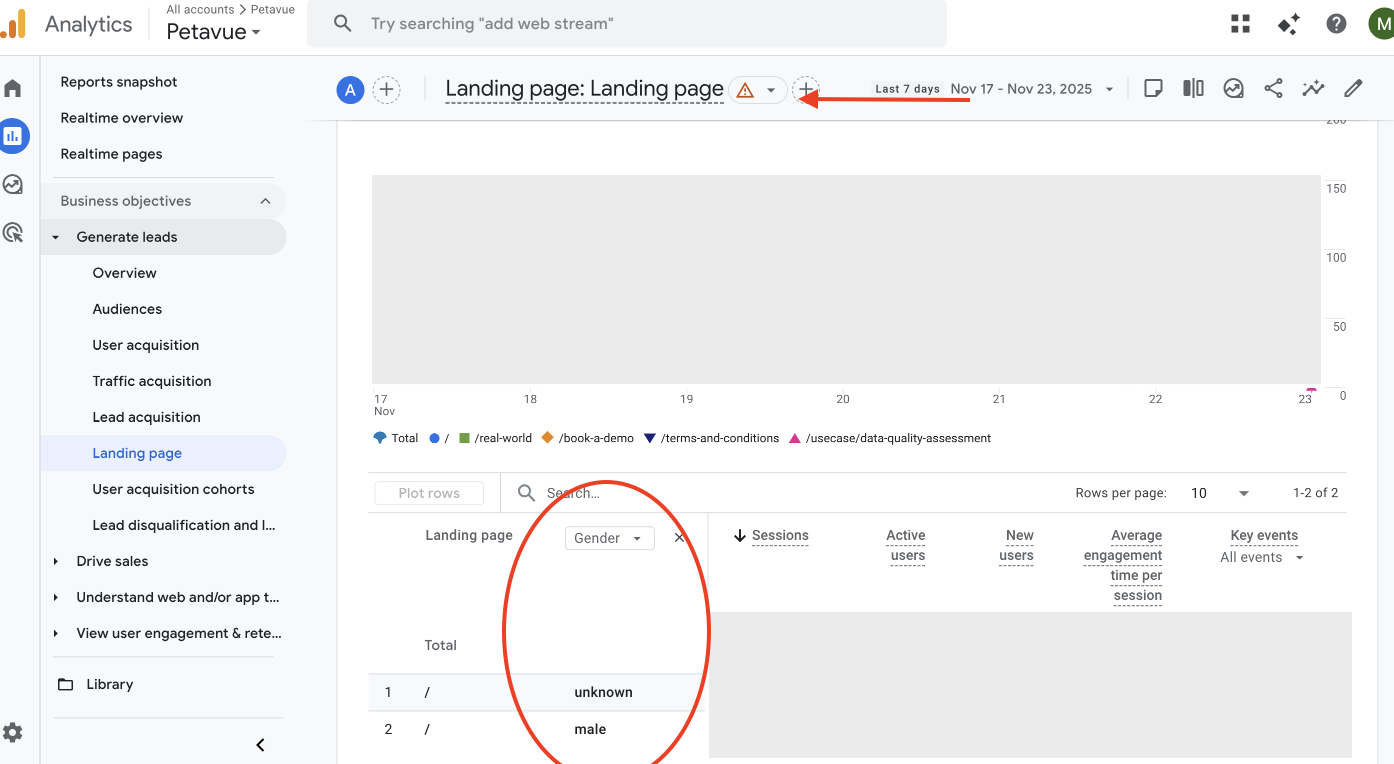
- In the GA4 Console: You might still see numbers, but they will be flagged with an Orange Triangle warning icon.
- In Google Sheets: The API blocks the data entirely. If thresholding is triggered, the report will simply return empty results.
Is there a workaround?
No. There is no way to bypass this privacy restriction. If a specific dimension triggers thresholding, you cannot use that dimension in your report.
How to verify if a dimension is usable:
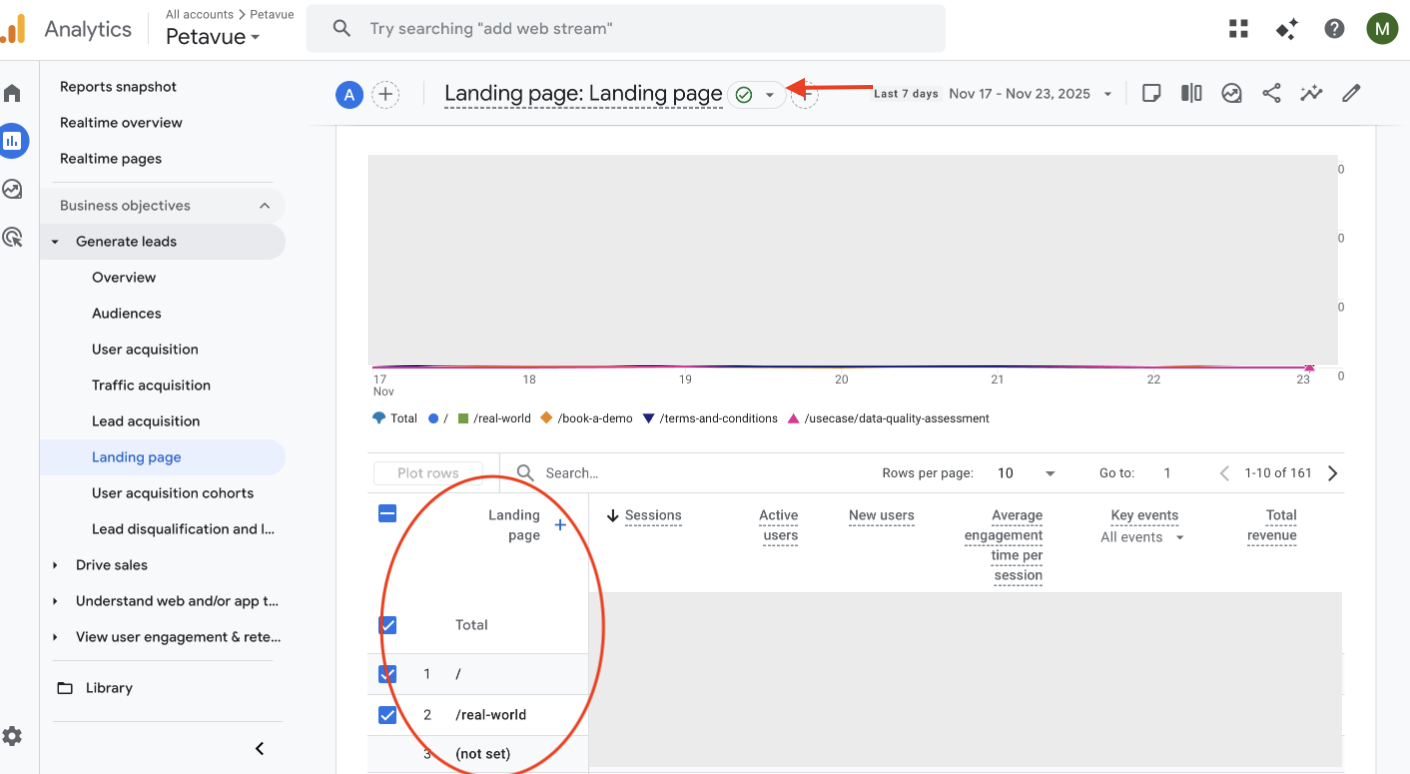
Before adding a sensitive dimension to your Google Sheet, test it in the GA4 Console first.
- Green Checkmark: The dimension is safe to use. You can include it in your report.
- Orange Triangle: Thresholding is applied. You must remove this dimension from your configuration; otherwise, the import will fail to return data.
Reference:
For more details on why data is withheld, please read the official Google documentation: About Data Thresholds.
2. Data Granularity & Value Differences (Metric Inflation)
The Issue:
You may notice that the value of a metric (like Total Users) changes depending on the structure of your report. Specifically, as you add more dimensions to drill down deeper, the total count often increases.
Example of Discrepancy:
For example, the Total Users count for the USA might appear differently depending on the dimensions used:
- Country dimension only: 1,889 Users
- Country + Date: 1,946 Users
- Country + Date + City: 1,980 Users
Why this happens:
This is expected behavior in GA4 caused by Identity Resolution (Deduplication).
- High-Level Reports: When you run a simple report (e.g., just "Country"), GA4 can easily identify that a user on a phone and the same user on a laptop are the same person. It "deduplicates" them, counting them as 1 User.
- Granular Reports: As you add complex dimensions (like "City" + "Date"), it becomes harder for GA4 to stitch that identity together. The system often defaults to counting device IDs separately. If that same user visited from two devices on that specific date in that specific city, the granular report might count them as 2 Users.
Which number should I trust?
It depends on your goal:
- For Accurate Totals: Trust the High-Level Report (fewer dimensions). It has the most accurate deduplication of unique users.
- For Context & Trends: Use the Granular Report. It is perfect for seeing how traffic is distributed across cities or dates, but do not try to sum up these rows to get your total user count, as it will be inflated.
3. Standard vs. Calculated Metrics
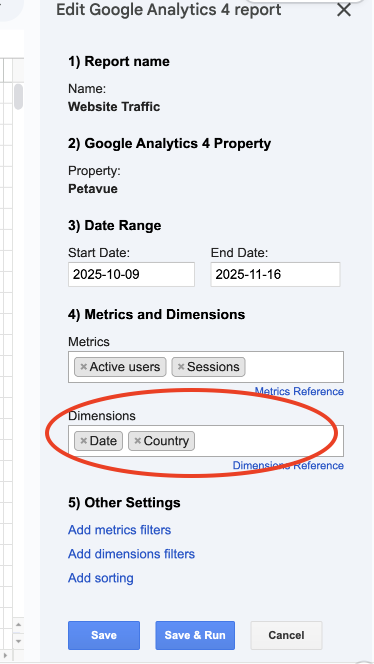
What you can import (Standard Metrics):
When building a report via the add-on, the dropdown menu will only populate with Standard Metrics. These are the native metrics that GA4 automatically calculates and makes available via their API.
- Examples: Active Users, Sessions, Engagement Rate, Event Count.
What you cannot import (Custom Metrics):
You cannot directly import metrics that require a custom formula or calculation based on other metrics.
- Example: If you want to analyze a custom metric like "Engagement Session per Active User" (which requires dividing Engagement Rate by Active Users), you will not find this pre-calculated field in the dropdown on Google Sheet.
The Solution:
Instead of trying to import the final calculation, you should import the "raw ingredients."
- In Google Sheets: Import both Engagement Rate and Active Users as separate columns.
- In Petavue: Once the data is synced, use a Key Definition to configure the formula. Petavue will handle the calculation (Metric A / Metric B) dynamically on top of the raw data.
4. API Limits & The Integration Advantage
The Hard Limit:
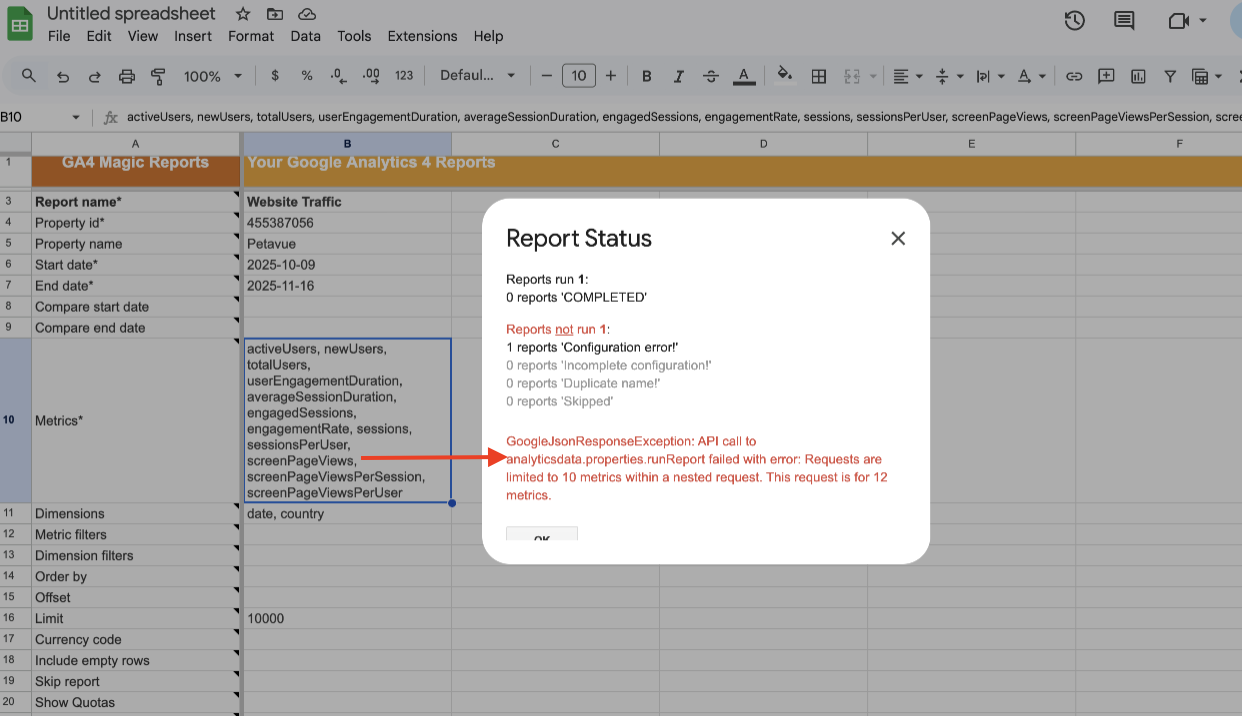
For a single report configuration in this add-on, Google allows a maximum of:
- 10 Metrics (e.g., Active Users, Sessions, Event Count, etc)
- 9 Dimensions (e.g., Country, Date, Device Category, etc)
If you try to add more than these many metrics, you will enounter below error:
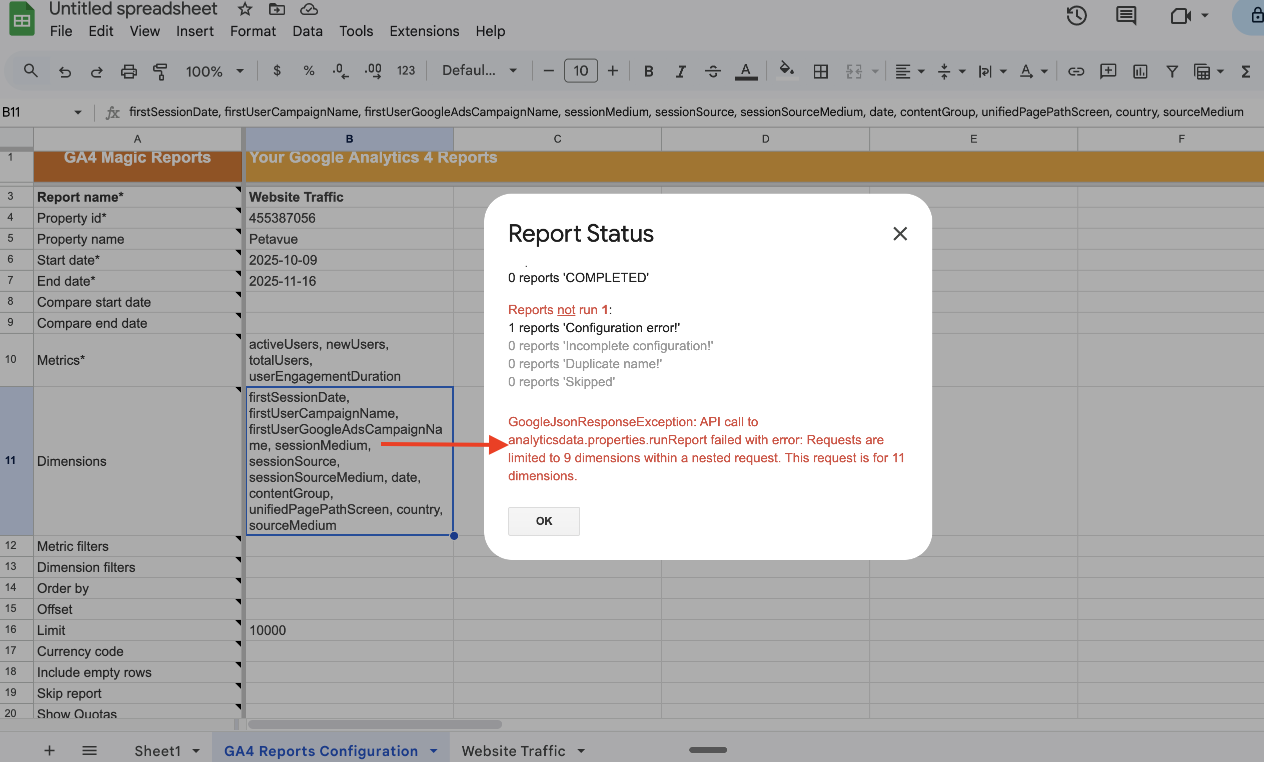
Why this is better than the GA4 Console:
While "9 dimensions" is a technical limit, it is a significant upgrade over using the GA4 website directly.
- In GA4 Console: You are restricted to viewing only 2 dimensions at a time (1 Primary Dimension + 1 Secondary Dimension).
- With Petavue: This integration allows you to combine up to 9 dimensions in a single row. This enables deep, granular analysis (e.g., viewing Source + Medium + Campaign + Device + Country all at once) that is simply impossible to view on the GA4 dashboard.
Summary: A New Way to Think About Reporting
Understanding these GA4 constraints is the key to getting accurate data. Instead of trying to force a single "Master Report" that breaks due to privacy rules or sampling, you now have a strategic blueprint:
- Isolate your topics: Build separate reports for specific goals (e.g., one for Traffic Sources, one for Audience Demographics) to avoid Thresholding.
- Verify first: Always check for the "Green Checkmark" in the GA4 console before building.
- Let Petavue handle the rest: While GA4 forces you to separate your data to get accurate exports, Petavue allows you to bring it all back together. By syncing these distinct, high-quality reports into Petavue, you can analyze them side-by-side and calculate the metrics that matter most to your business.
Ready to build?
Now that you understand how to structure your reports for maximum accuracy, you are ready to set up the connection. Check out Step-by-Step Guide: Integrating GA4 with Petavue.
Not sure which dimensions to pick?
Check out our Quick Start: 3 Essential GA4 Reports to get started with safe, high-value templates.