Step-by-Step Guide: Integrating GA4 with Petavue
This guide provides a step-by-step process for integrating your Google Analytics 4 (GA4) data with Petavue using the "GA4 Magic Reports" add-on for Google Sheets.
Account Prerequisites
To successfully connect GA4 to Google Sheets and Petavue, please ensure the following:
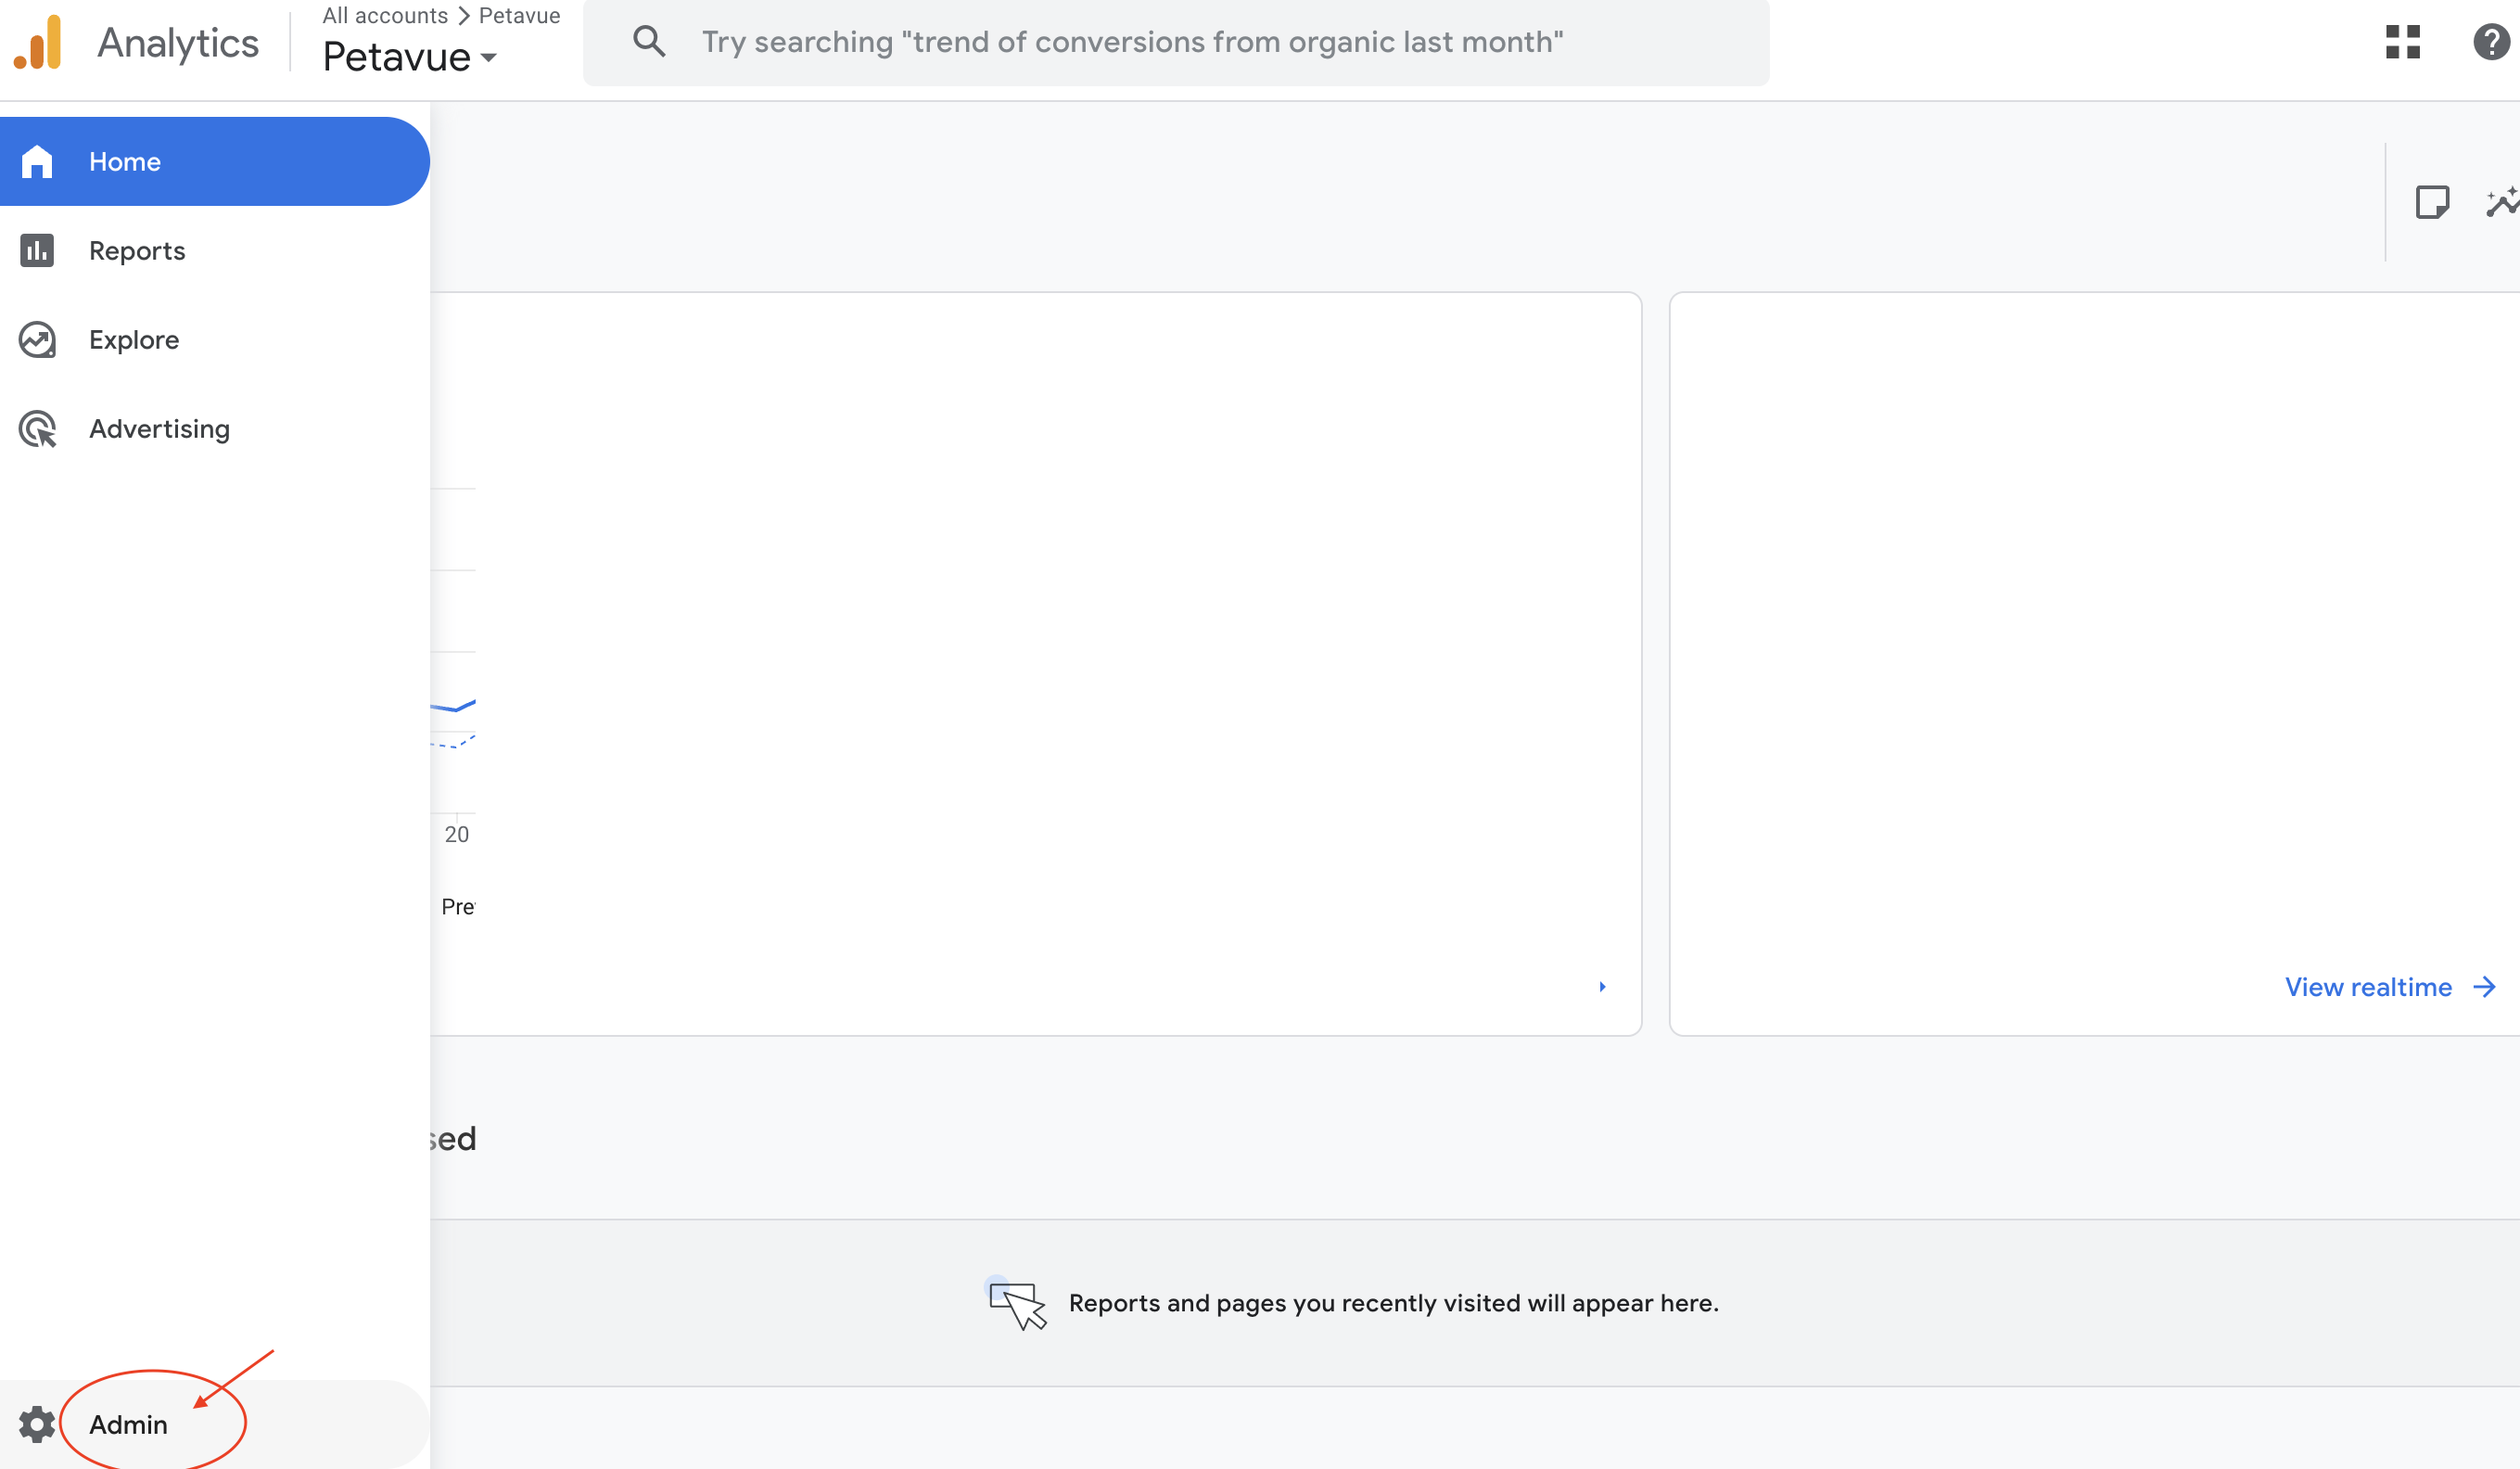
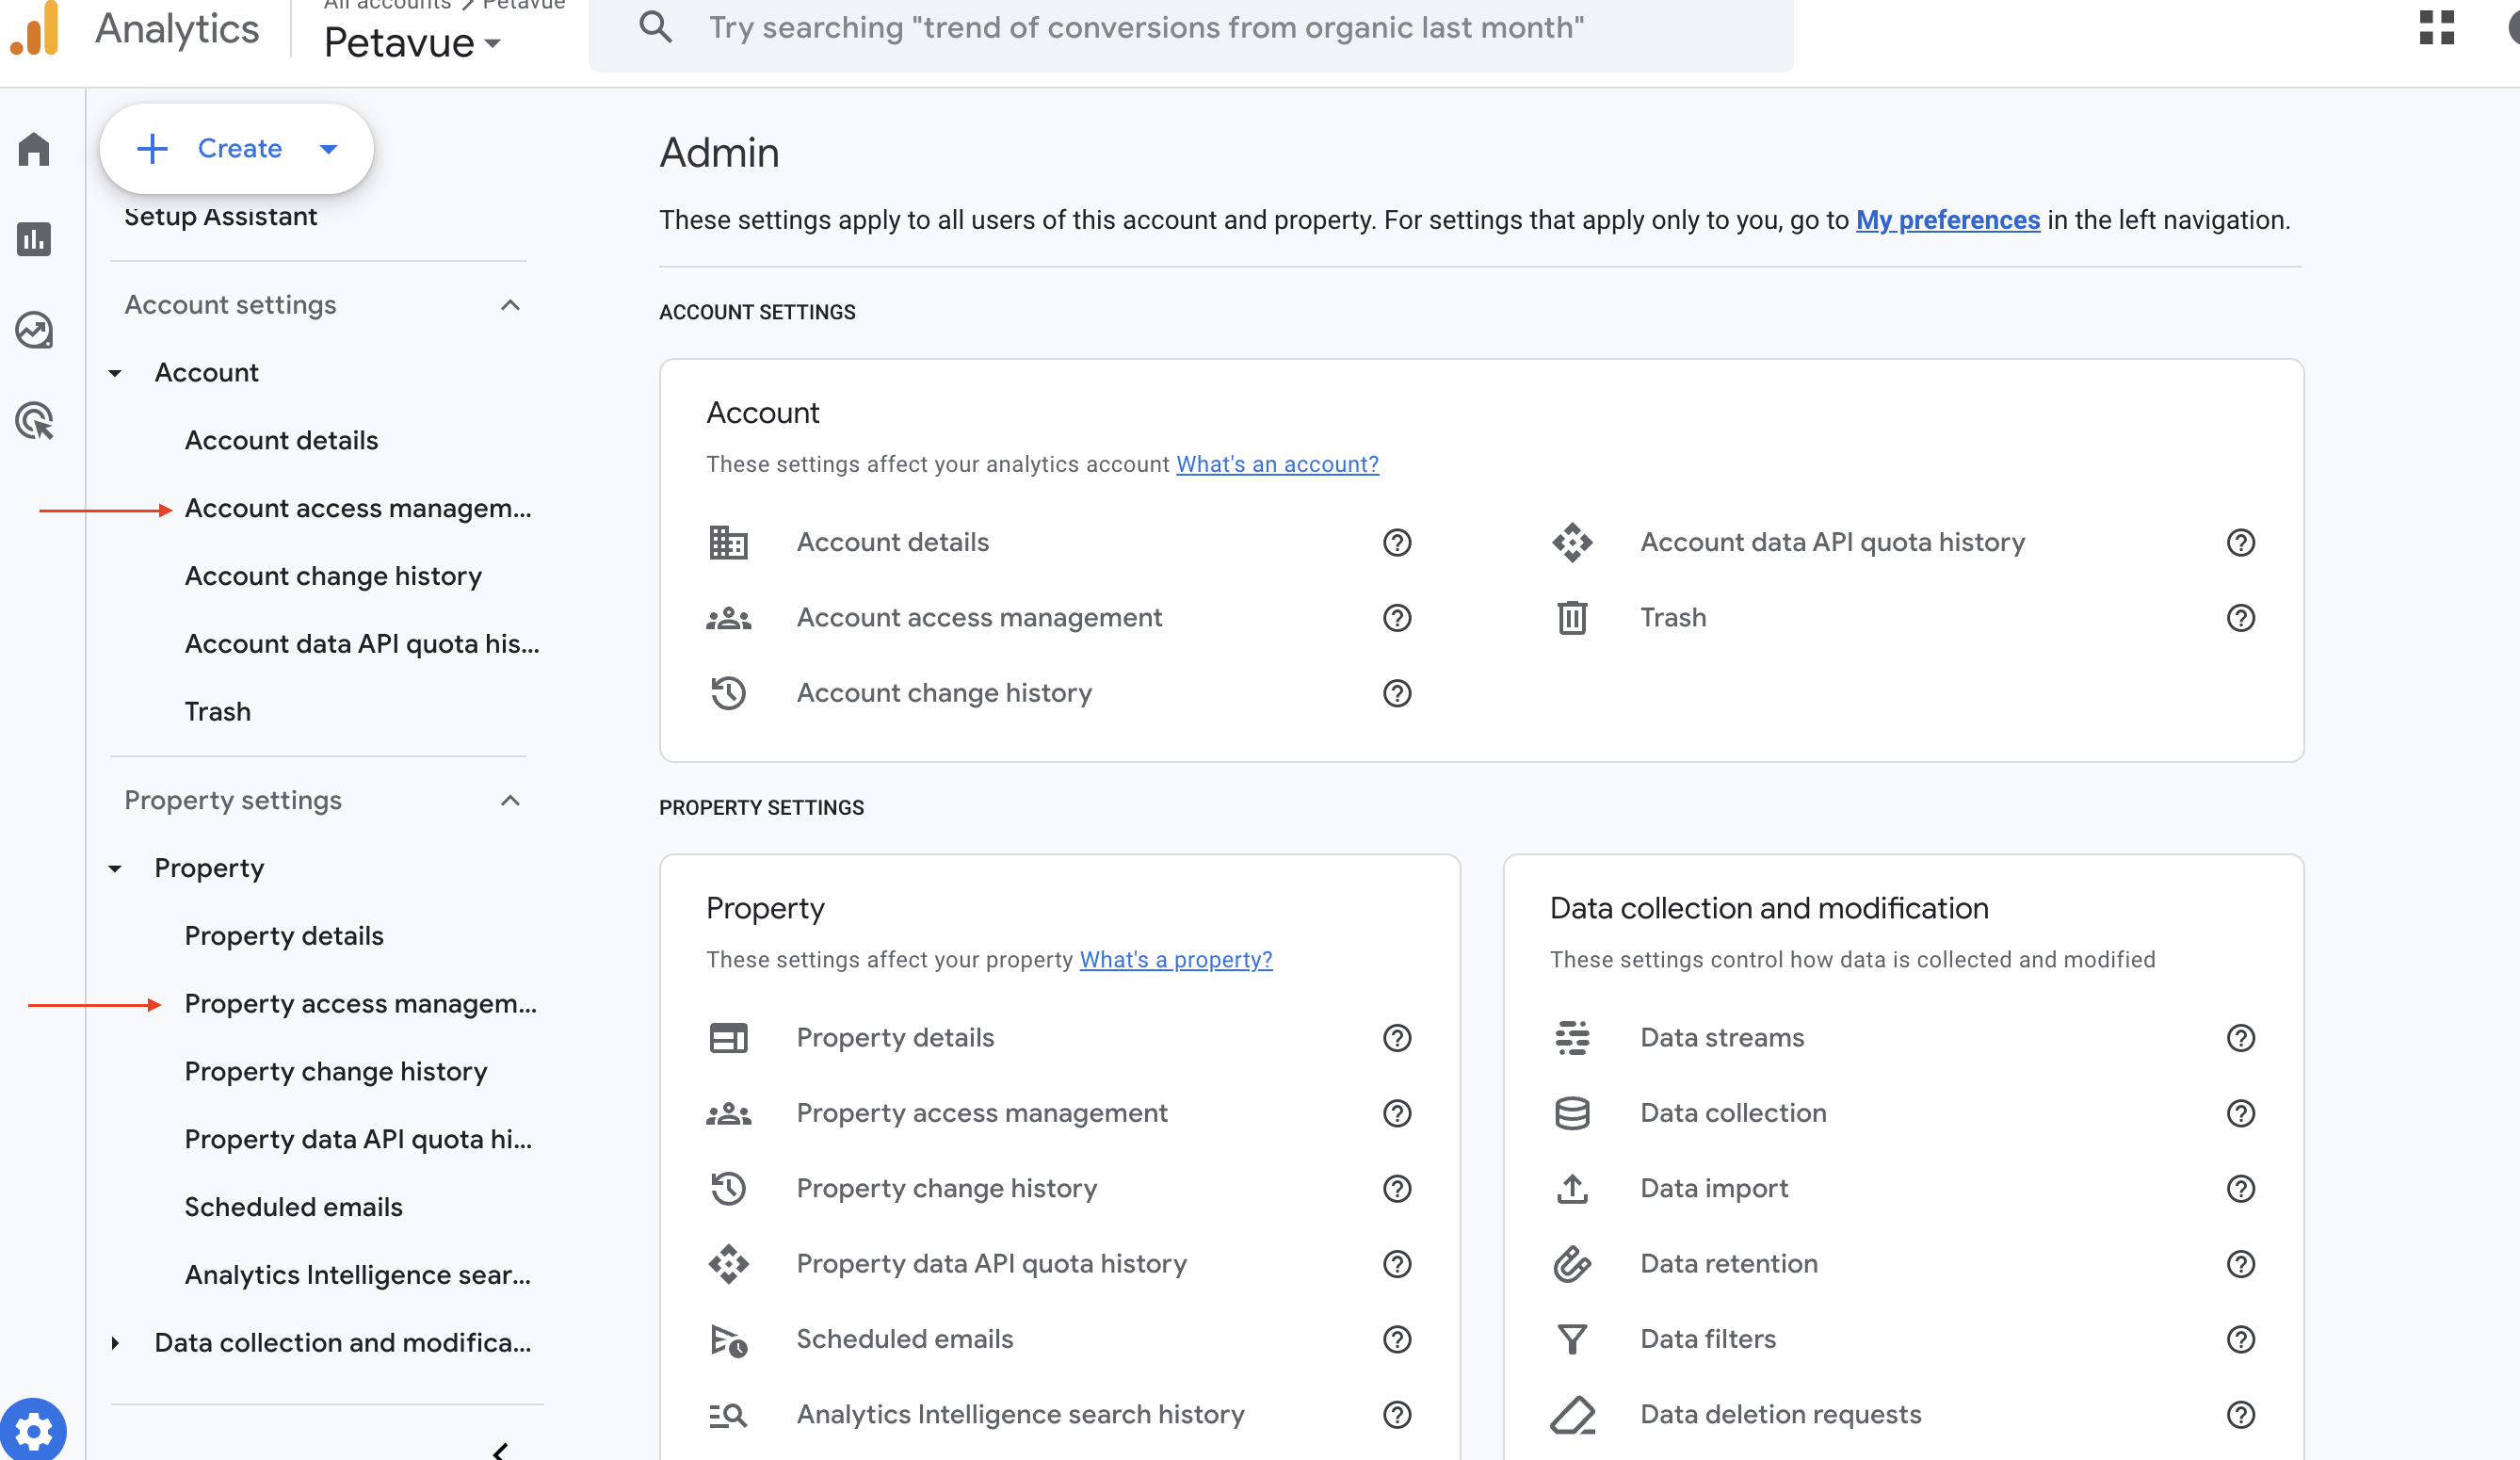
- GA4 User Permissions: You must be logged into Google Analytics 4 as an Administrator or Editor. You can verify this role in the GA4 Admin Settings under:
- Admin Settings → Account → Account access management
- OR Admin Settings → Property → Property access management
Matching Email Accounts: The Google Account (email ID) you use to log into Google Sheets must be the same account that has the Admin/Editor access to your GA4 property.
Strict Browser Session Isolation:
It is not enough to simply close tabs. You cannot be logged into multiple Google accounts (e.g., Personal Gmail + Work Google Workspace) within the same browser profile.
- Requirement: Use a separate Incognito/Private window or a distinct Chrome Browser Profile where only the GA4 Admin account is logged in.
- Reason: Google Sheets add-ons often fail to authenticate if multiple accounts are active in the same browser session.
BEFORE YOU START: Critical Strategy to Import Reports from GA4
Integrating GA4 is not as simple as "dumping all data" into one sheet. GA4 has strict privacy rules (Thresholding) and counting behaviors (Granularity) that can cause your reports to return empty rows or inaccurate numbers if configured incorrectly.
You must read our Best Practices guide before proceeding:
Read: Understanding GA4 Data Constraints & Best Practices
Proceed with the steps below only after you understand why you may need to build multiple specific reports instead of one master report
Step 1: Connect Petavue to Google Sheets
To get started, log into app.petavue.com. Navigate to Settings —> Integrations. Find Google Sheets and click "Connect".
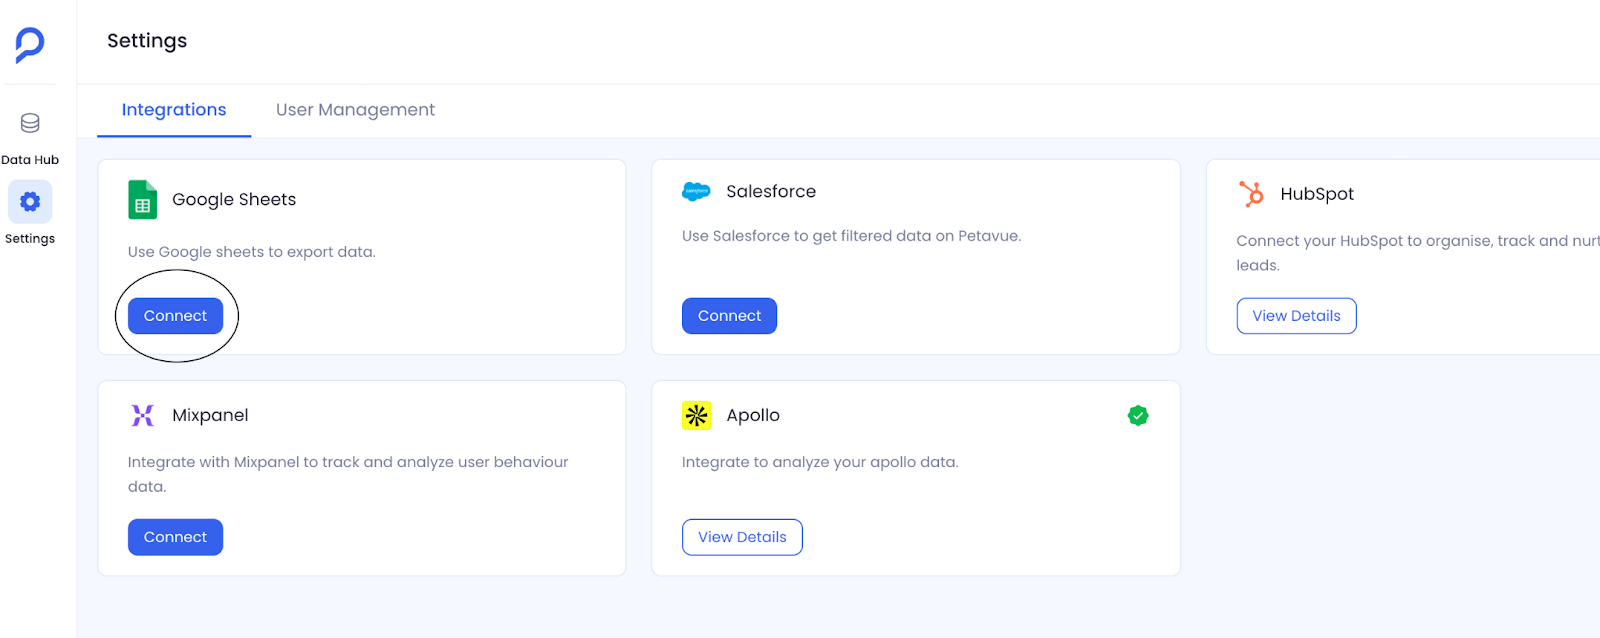
This will redirect you to Google's login page. Select the Google account you want to use (ensure it matches your GA4 Admin account), then approve the connection. Once the approval is complete, the Google Sheet integration with Petavue is all set.
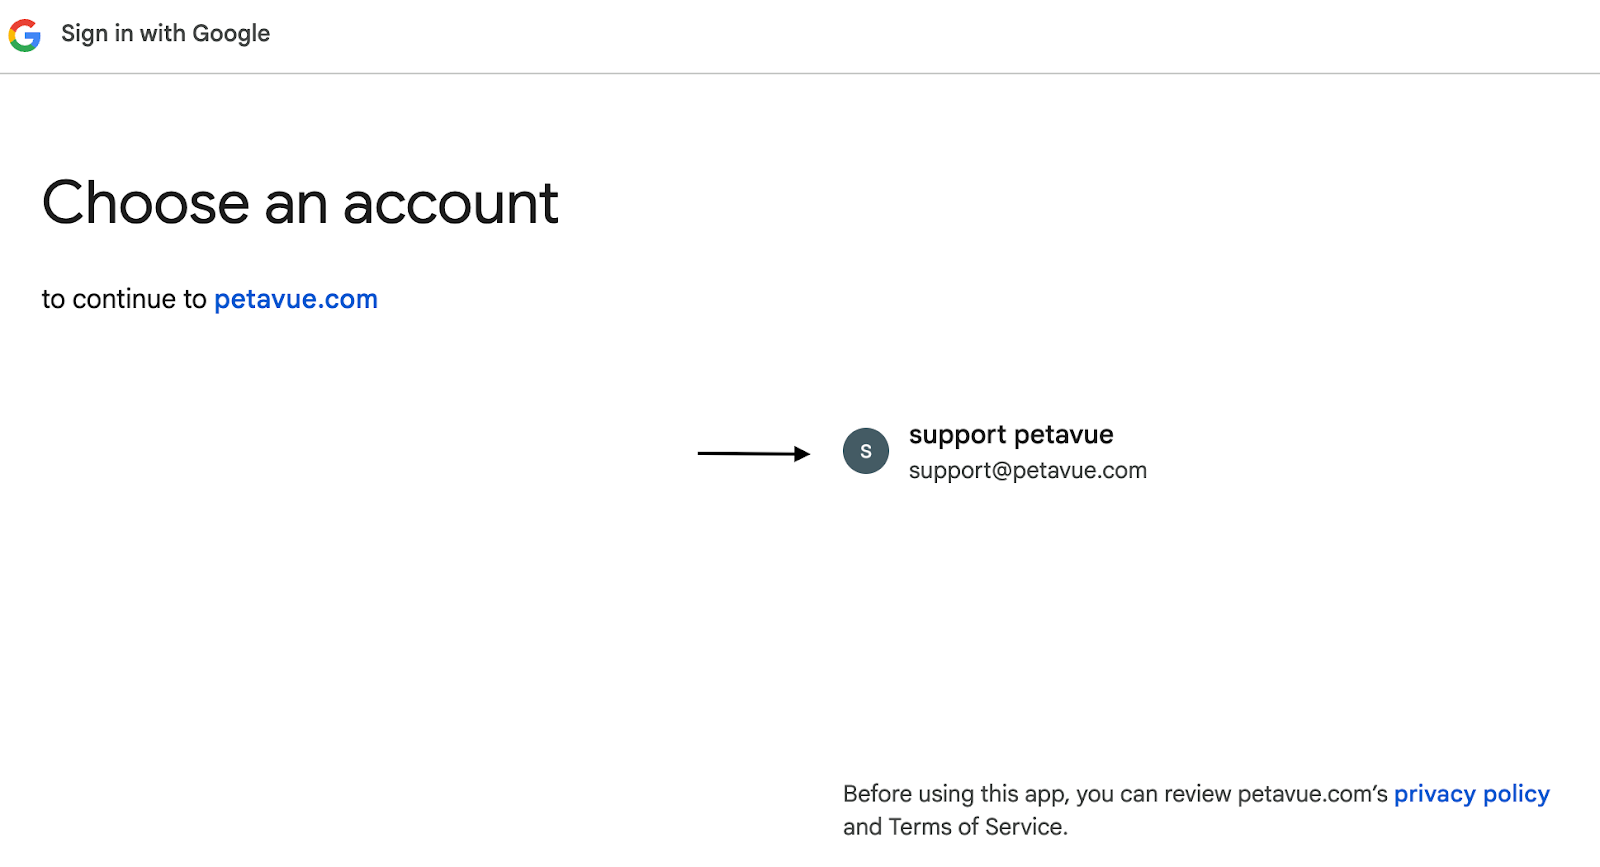
Note: After selecting your account, Google may show a warning. This is normal as we are in the process of getting Petavue fully verified. Click Continue to finish setting up the integration.

Step 2: Install the 'GA4 Magic Reports' Add-on
Next, you need to install the specific Google Sheets add-on that powers this integration.
After extensive testing, we have selected "GA4 Magic Reports" for this process. It is currently the highest-rated and most stable GA4 extension available in the Marketplace.
Why this tool? (Security & Privacy)
This extension operates as a secure "pass-through" tool. It connects directly to the official GA4 API to fetch your data and writes it immediately to your Google Sheet.
- No External Storage: The developer (Analytics Traps) does not view, save, or store your analytics data on their servers. You can verify this in their Privacy Policy.
- Direct Connection: Data flows strictly between your Google Analytics account and your Google Sheet.
Installation Steps:
Click the link below to go to the Google Workspace Marketplace:
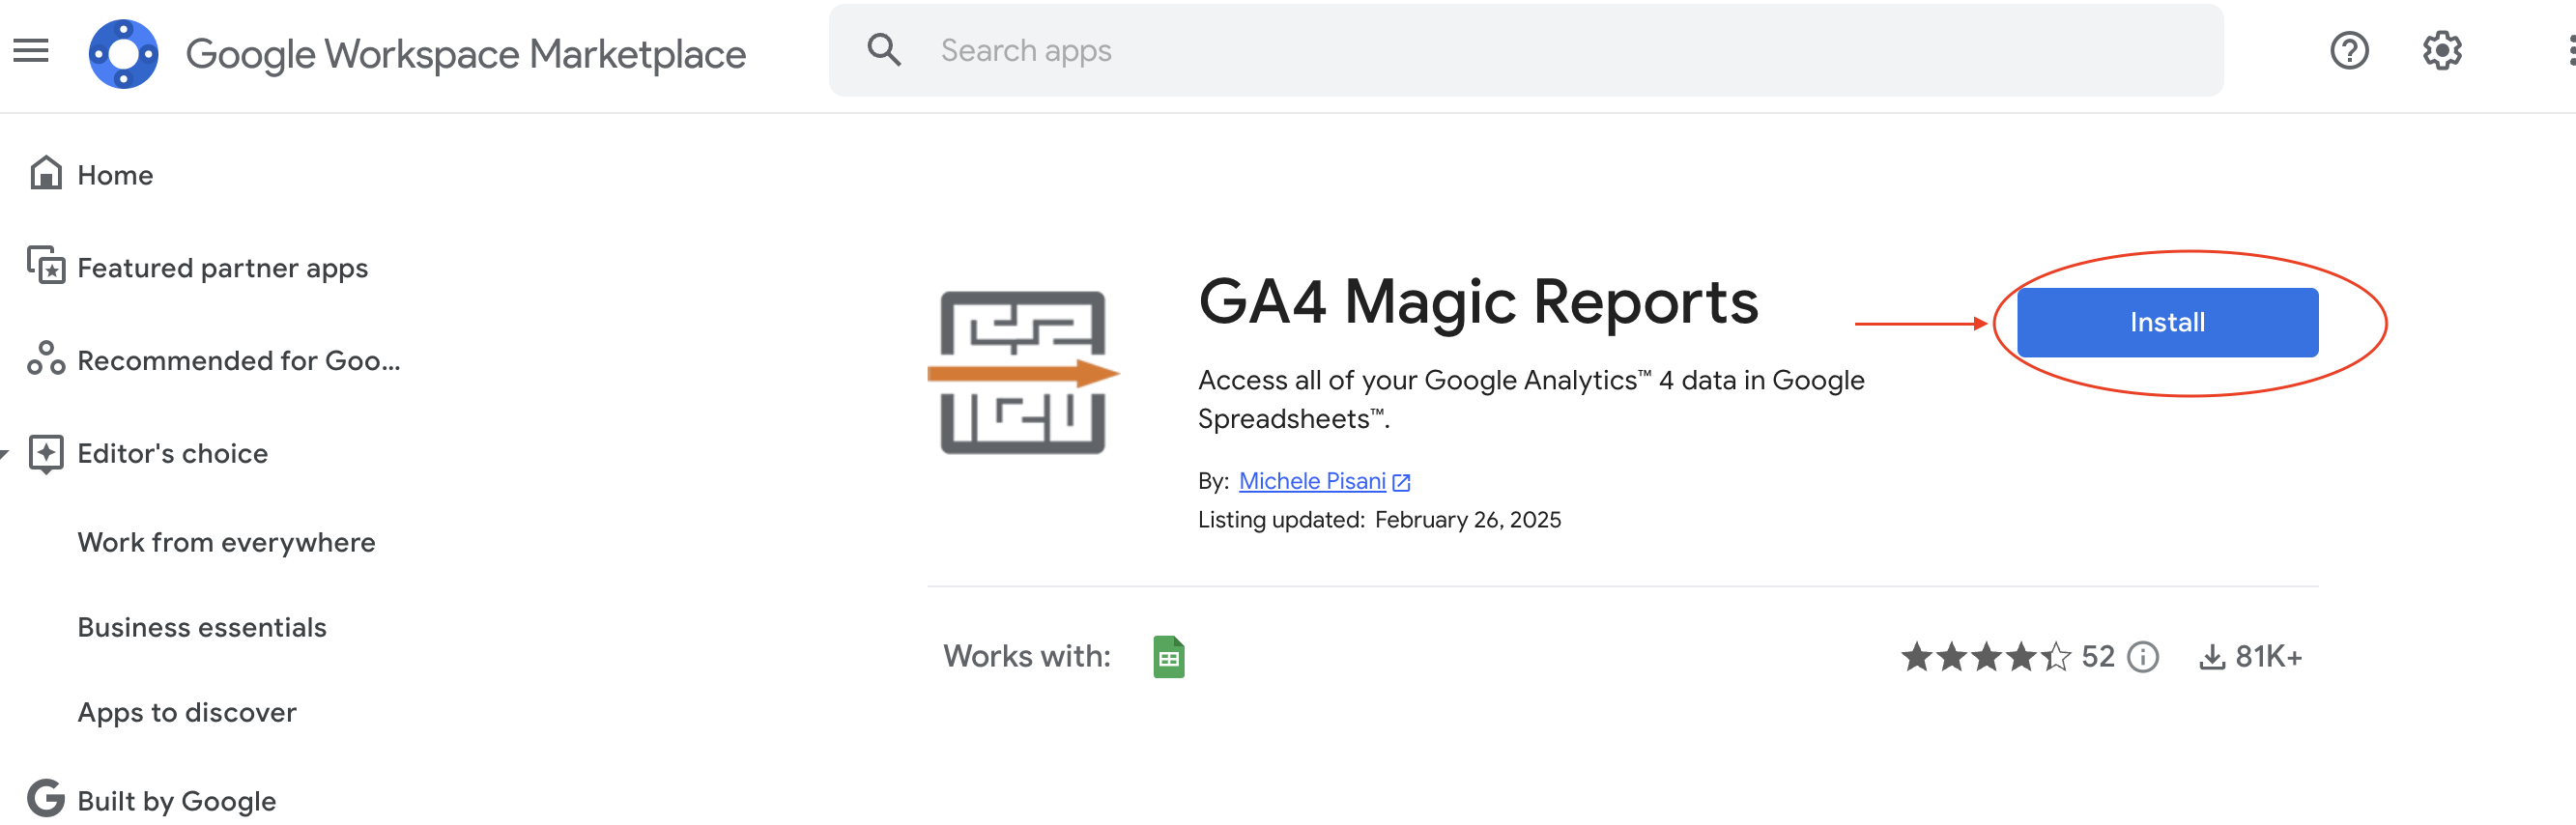
- Click Install and follow the on-screen prompts.
- When asked for permissions, grant access to "See and download your Google Analytics data" and "See/Edit Google Sheets." This is necessary for the tool to write the reports into your spreadsheet.
Step 3: Create Your First GA4 Report
Once the add-on is installed, you can configure your first report.
Important: Plan Before You Build
To successfully use this tool, you must have a clear understanding of the report you want to build. We strongly recommend verifying your data on the Google Analytics website before configuring it here.
- Experiment in GA4 Console: Go to your GA4 account (on analytics.google.com) and try adding the specific dimensions and metrics you are interested in.
- Test the Combination: Verify that the dimensions work well together and that Google displays the data you expect (look for the Green Checkmark).
- Build in Sheets: Once you have "planned" the report on the console and confirmed the data looks correct, return to Google Sheets and add those exact dimensions and metrics to the configuration below.
Need inspiration? We have prepared templates for the most common reports (Traffic, Landing Pages, etc.) View 3 Essential GA4 Reports to Build.
Configuration Steps:
- Open a new or existing Google Sheet.
- Navigate to the menu bar and click Extensions → GA4 Magic Reports → Create new report.
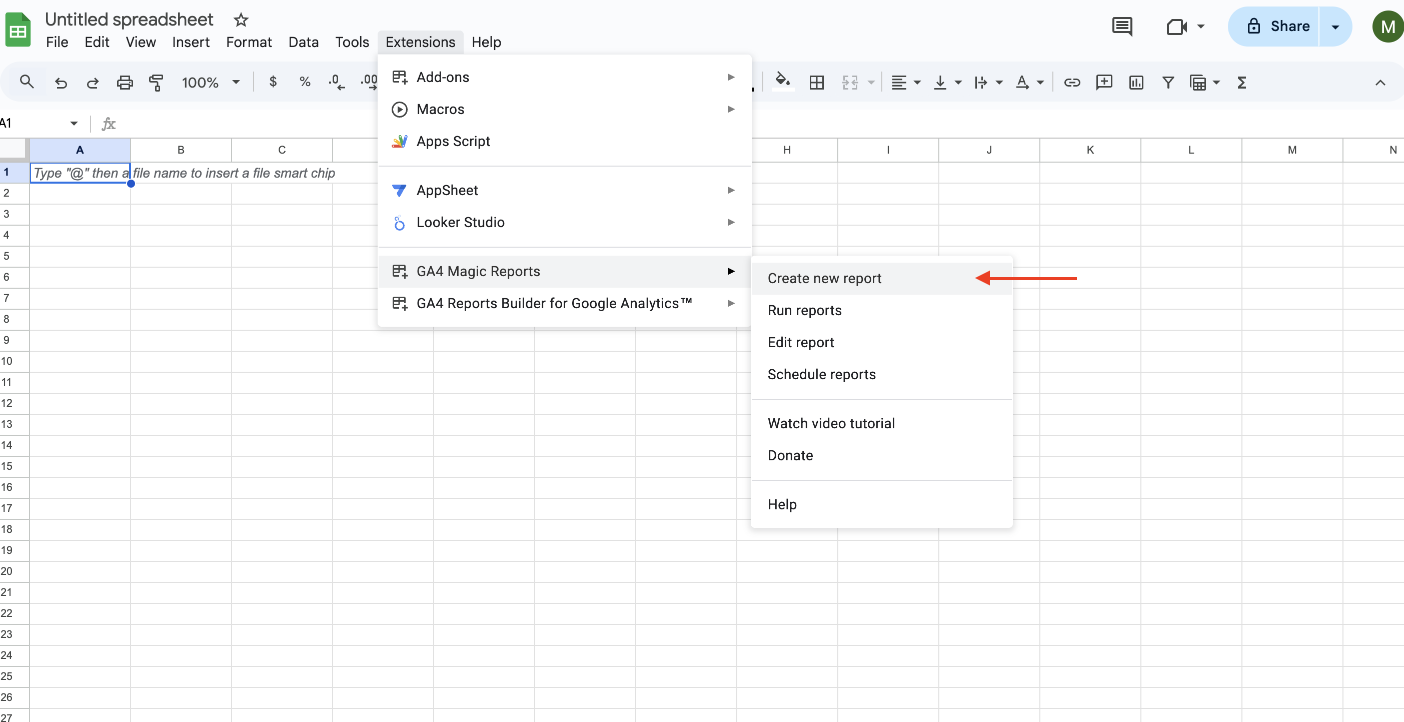
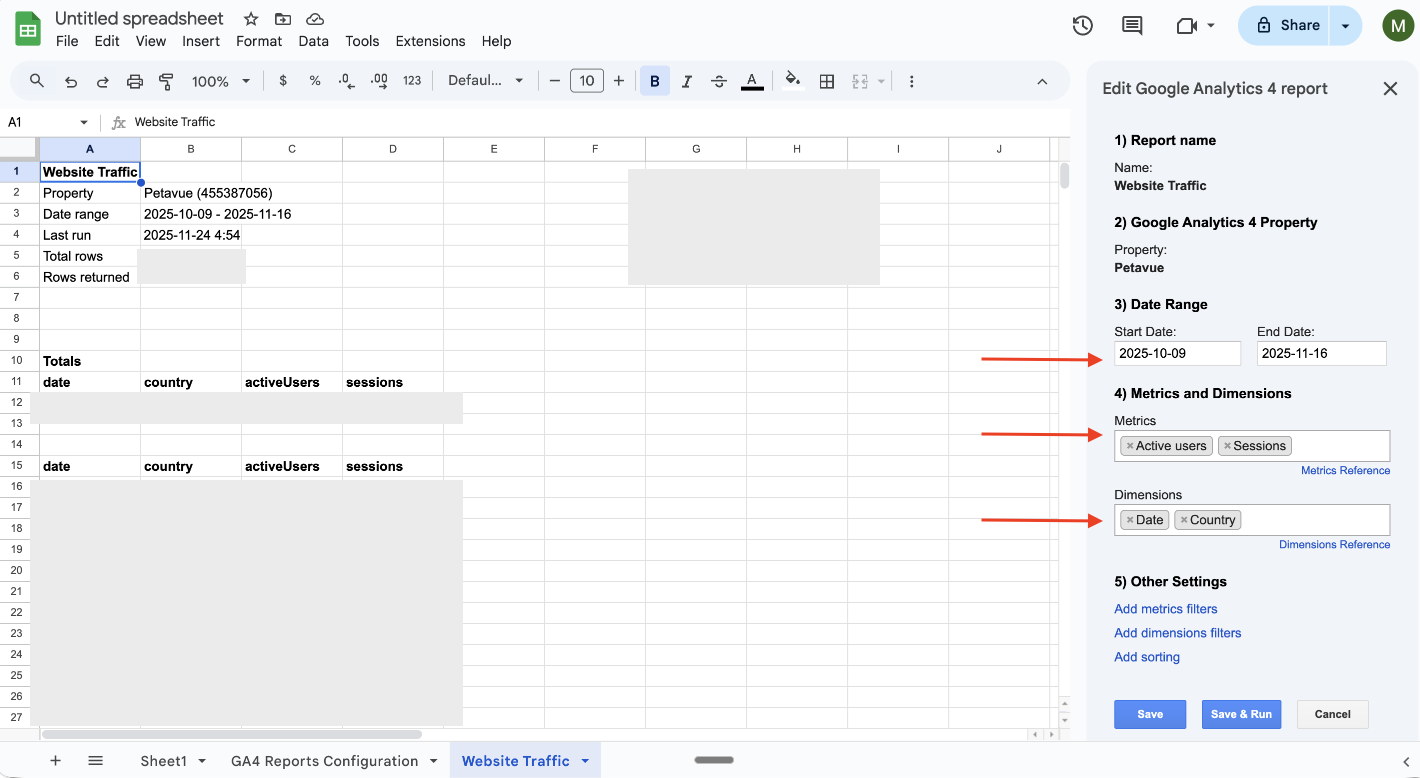
- A configuration sidebar will open on the right. Fill in the required details for your report:
- Report Name: Give your report a descriptive name (e.g., "Monthly User Traffic").
- Google Analytics 4 Account: Select the GA4 account and property you want to pull data from.
- Date Range: Choose a start and end date for your report.
- Dimensions & Metrics: Select the dimensions (e.g., Page path, Country) and metrics (e.g., Active users, Sessions) you need. Remember the limit of 10 metrics and 9 dimensions.
- Filters (Optional): Apply any filters to narrow down your data.
- Click the Save button at the bottom to save the report. If you want to press Save and Run Button.
A new tab, titled Report Configuration, will be created in your sheet. This tab holds the settings for the report you just defined.
Step 4: Run the Report to Fetch Data
After configuring the report, you need to run it to pull the data from Google Analytics.
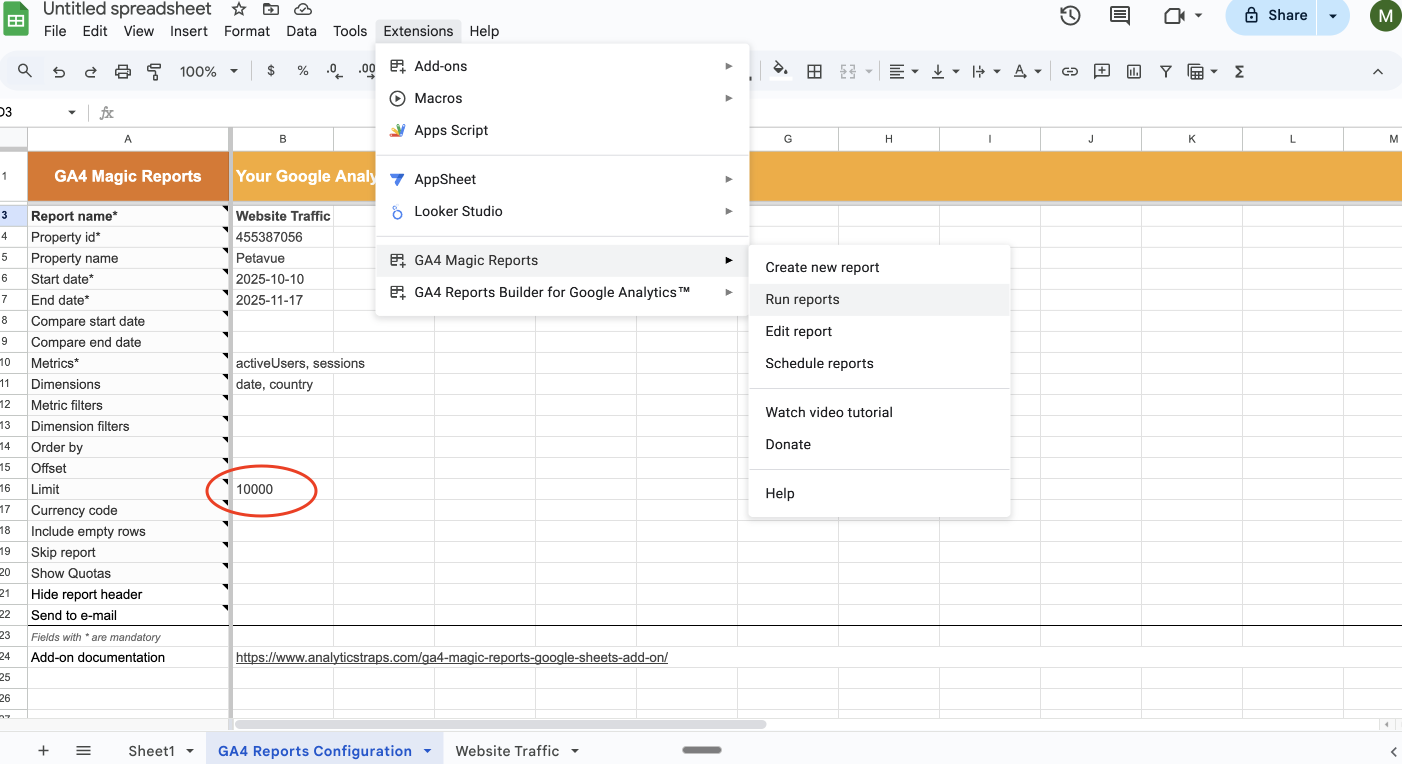
Important Note on Data Limit: Before running the report, please make sure you have set the desired limit for the number of records to import. By default, this limit is set at 1,000. You can adjust this within the Report Configuration tab of your Google Sheet to suit your data volume needs.
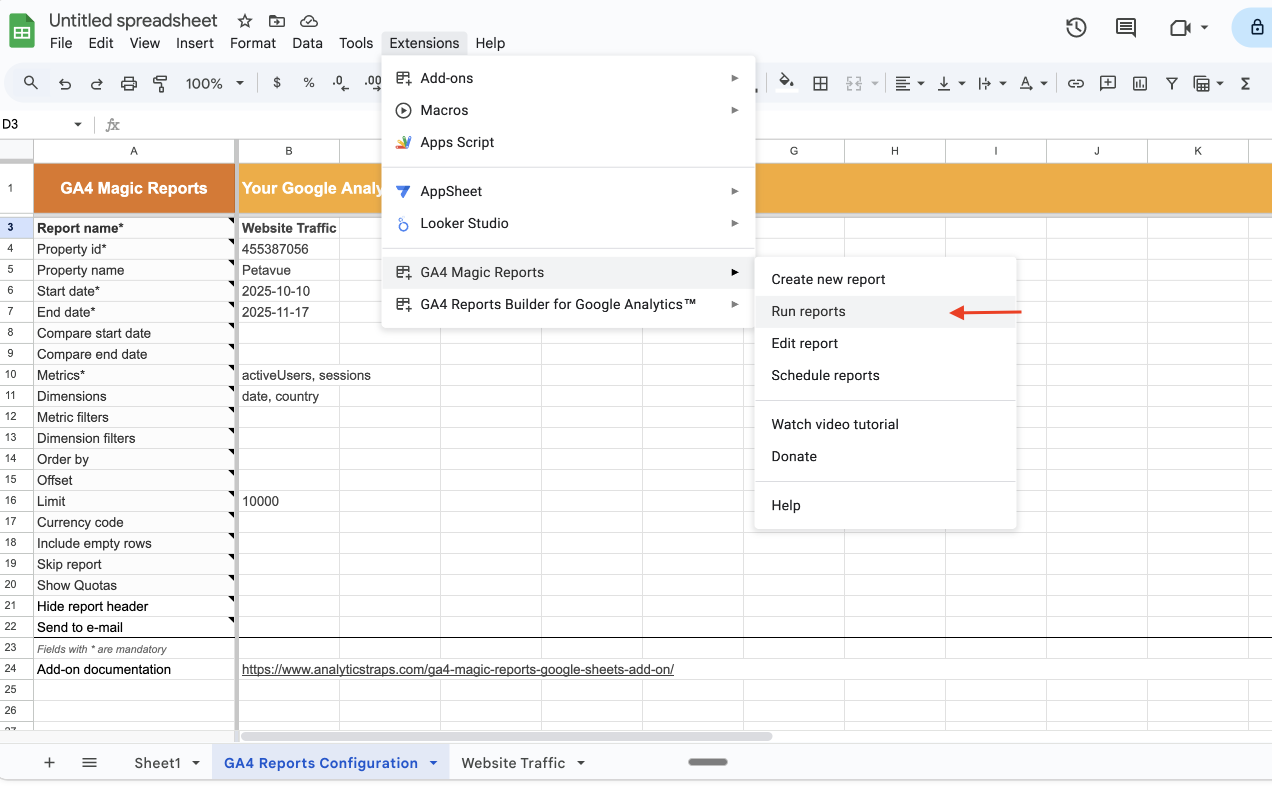
To run the report:
- Go to Extensions → GA4 Magic Reports → Run reports.
- The add-on will process your request. When finished, a new tab will appear in your spreadsheet, named after the report you created.
- This new tab contains a summary of the report and the complete dataset you requested.
Note: Before you run the report, please set the limit of records you want to import from google analytics. By default it will be set at 10000. You may increase it based on your need.
Step 5: Editing a Report
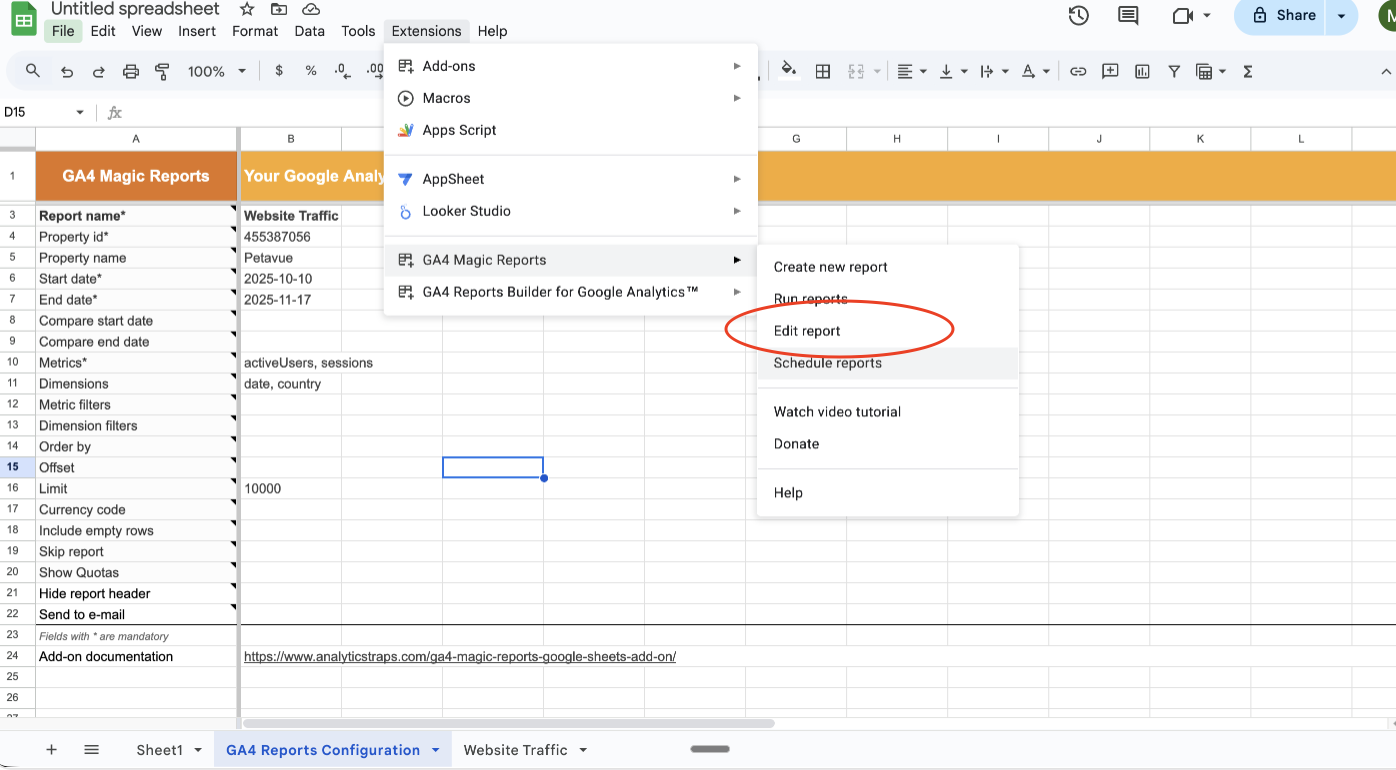
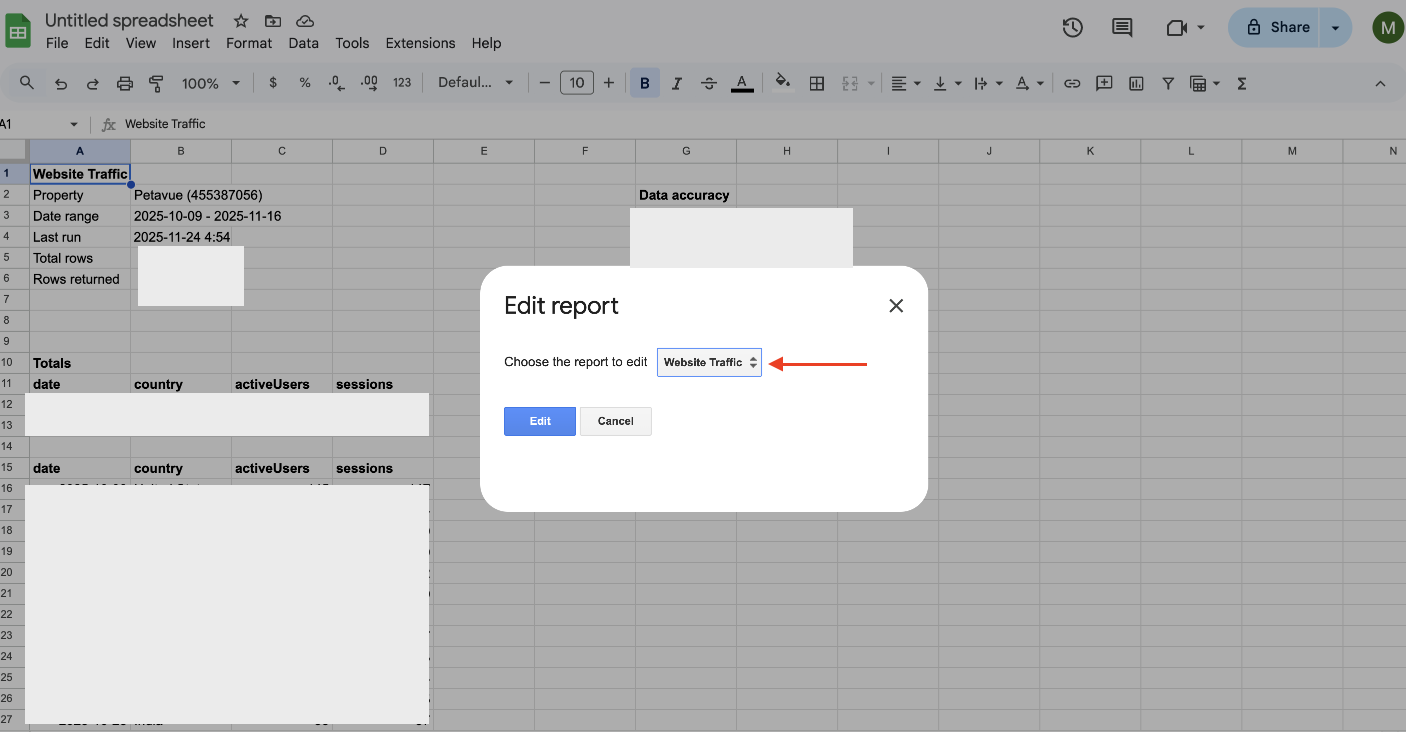
If you need to change dimensions, metrics, or date ranges after creating a report, you can easily edit it.
- Navigate to Extensions → GA4 Magic Reports → Edit report.
- Select the report you wish to modify.
- Make your changes in the sidebar and save.
Step 6: Share Your Google Sheet with Petavue
Once you've created the Google Sheet with your GA reports, you can share it with the Petavue team to sync the data.
- Simply send the link of the spreadsheet to the Petavue team via Slack or by emailing support@petavue.com.
- Once the Petavue team adds this GA4 data as a source, you can access the tables and columns synced under Data Hub —> Dictionary.
Note: The Google account used for the Google Sheets integration with Petavue must have Owner or Editor permission of the sheet containing the GA4 reports for this integration to work.
Adding Multiple Reports & Scheduling Refreshes
Adding Multiple Reports
You can add several reports to the same Google Sheet to pull different sets of data.
- Simply repeat the process in Step 3. Each new report will be added as a new row in the Report Configuration tab.
- When you run the reports again, the add-on will execute all configured reports, refreshing the data in their respective tabs.
Scheduling Automatic Refreshes
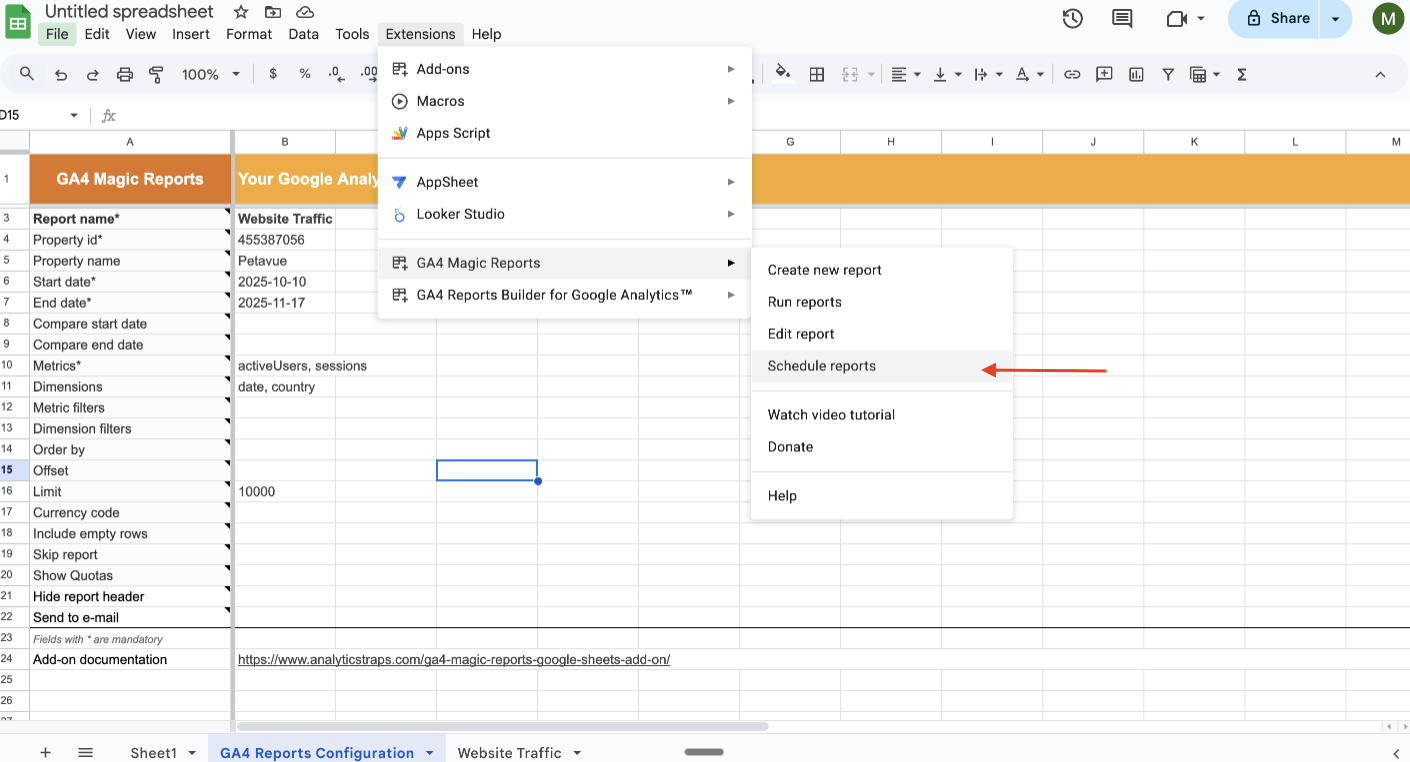
To ensure your data in Petavue is always up-to-date without manual intervention, you can schedule the reports to run automatically.
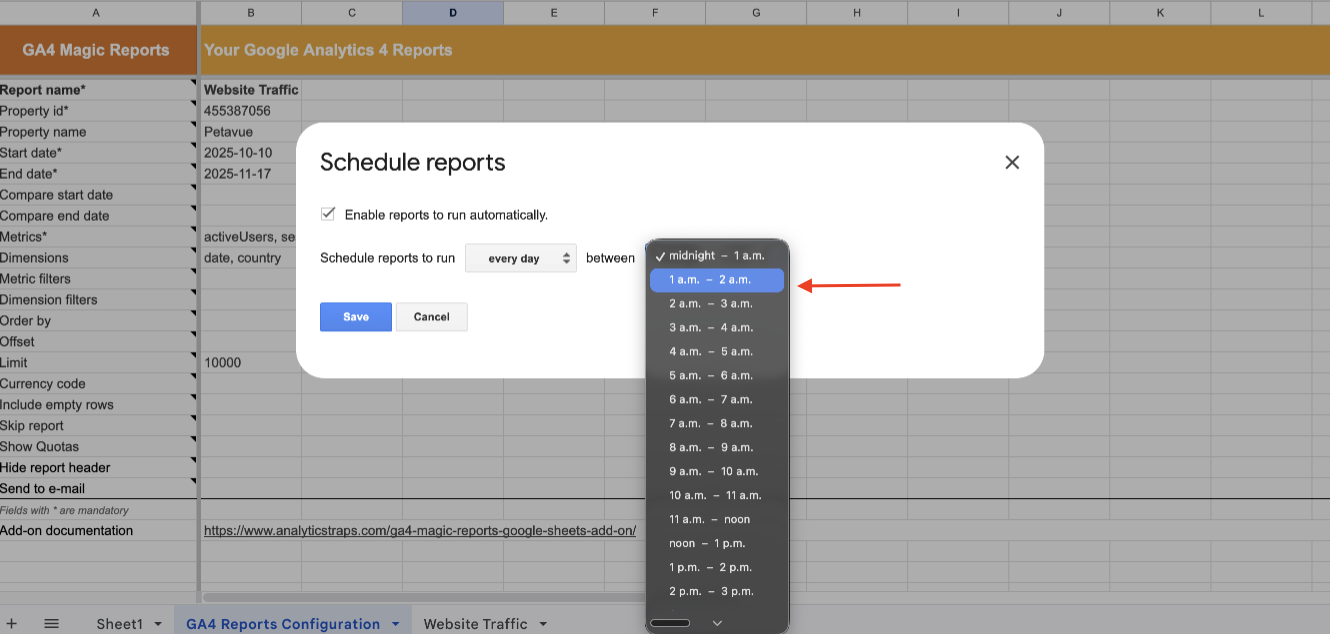
- Navigate to Extensions → GA4 Magic Reports → Schedule reports.
- In the pop-up window, check the box to Enable reports to run automatically.
- Choose the desired frequency (daily, weekly, etc.) and the time of day for the refresh to occur.
- Click Save.
Finalizing the Sync & Next Steps
The integration with Petavue relies entirely on the data present in your Google Sheet. For Petavue to display the latest numbers, the report in the Google Sheet must first be refreshed (either through the automated schedule you set or a manual run).
- Sync Frequency: Petavue automatically syncs with your Google Sheet once every 24 hours.
- Data Freshness: This ensures your Petavue dashboard reflects a stable, daily snapshot of your performance, rather than a volatile real-time view.
What you can do now:
You are now ready to run the same reports you used to run in GA4, but with significantly more power. By moving this data into Petavue, you gain the independence to analyze metrics with much deeper granularity (using up to 9 dimensions per row). Most importantly, you can now stitch the complete user journey together—connecting your top-of-funnel GA4 web traffic data with the rest of your GTM stack directly inside Petavue.
Ready to start analyzing? Check out 3 Essential GA4 Reports to see what metrics and dimensions you can get started with.