Best Practices for Analyzing Data in Petavue
While Petavue’s conversational interface makes data analysis intuitive, adopting a set of best practices can elevate your analysis experience from good to exceptional. Think of yourself not just as someone asking questions, but as agents, guiding the system to produce the most accurate, efficient, and insightful analysis possible — helping you get to critical insights in minutes, not the weeks or ages required by legacy tools.
This guide outlines key strategies for interacting with Petavue throughout the analysis lifecycle. Each step builds on the last, forming a repeatable workflow for accurate, explainable, and reusable analysis. Here’s a snapshot, with details to follow.
Reviewing and Refining Your Analysis Plan — Verify tables, filters, joins, and output logic before you approve execution.
Diagnosing Uncertainty in Data — Use Petavue’s diagnostic tools to validate columns, relationships, and completeness.
Executing with Control — Stop, resume, or modify runs on the fly without losing progress.
Verifying and Iterating Toward Better Results — Understand how results were produced, validate findings, and refine follow-ups.
Saving Logic as Key Definitions (KDs) — Standardize recurring metrics and formulas so everyone analyzes with the same definitions.
Managing Chat Sessions Effectively — Reference past analyses, manage long conversations, and keep your workspace organized.
1. Reviewing and Refining Your Analysis Plan (Before You Run Anything)
The analysis plan is the single most important checkpoint in the Petavue workflow. Treating it as a contract for the work to be done ensures the final output is precisely what you intended.
A. Read and Verify Every Detail: Before giving the green light, take a moment to review the plan Petavue generates critically:
Verify Analytical Filters: Scrutinize the logic given in the plan.
Joins: Are the correct tables joined together with proper association or merge path for a particular use case or a step?
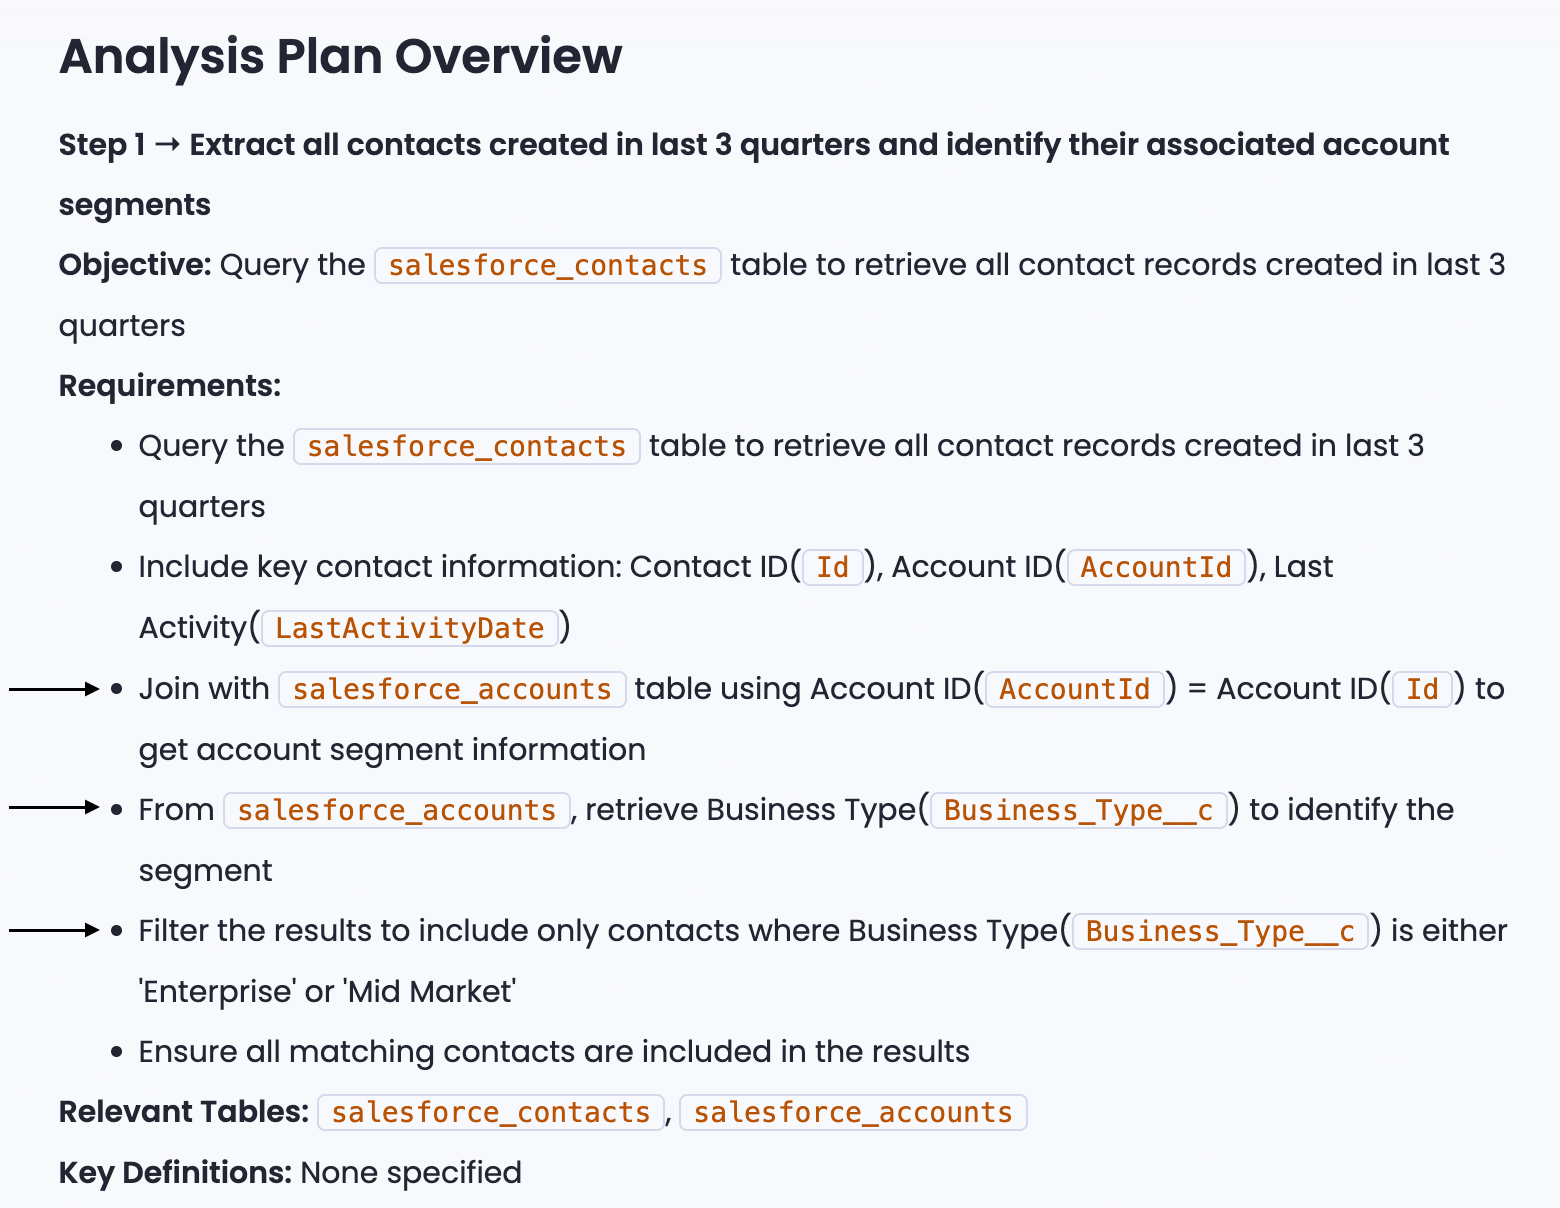
Table-Columns: Are the filters using the intended columns? (e.g., opportunity.close_date vs. account.creation_date).
Conditions: Is the condition itself correct? (e.g., >=100, IN ('USA', 'Canada'), is not NULL).
- Check Final Output Columns: Are the fields listed for the final presentation the ones you need to see?


Confirm the Sequence of Execution: Does the order of steps make logical sense for your analysis? Not so correct sequences could also sometimes lead to different results.
B. Provide Clear and Consolidated Feedback: If the plan needs correction, your feedback is crucial. You can modify any part of the plan by sending a follow-up message.
- Add, Remove, or Modify: Your feedback can be an instruction to add a new detail, remove an existing step, or modify a condition.

Read the Regenerated Plan: After every modification, Petavue will present a new plan. Review it with the same diligence as the first one to ensure your changes were interpreted correctly.
Best Practice: To avoid a lengthy back-and-forth, try to consolidate all your modification requests for a plan into a single, clear prompt. For example: "In step 1, change the date filter to the last 9 months. In step 3, use the 'industry_segment' column from the accounts table. Also, add a new step to filter out any results where revenue is zero."
To know more about plan modification, check out this article.
2. Diagnosing Uncertainty: Validate Columns, Joins, and Filters Before Execution
If you're unsure about any part of the plan, especially the data it references, use Petavue’s diagnostic capabilities before executing.
Uncertain about a Field? Ask for Recommendations: If you’re not sure whether the plan is using the best column for a filter (e.g., there are multiple columns for 'region'), ask the system for guidance. Example Prompt: “Which column is best to use for segmenting customers into SMB, Mid-Market, and Enterprise? Show me the options and their data completion rates.”
- Unsure about Table Relationships? Ask About Associations: Data models can be complex. If you doubt the join logic proposed in the plan, ask the system to clarify the relationships between the tables involved. Example Prompt: “What are the possible ways to join the Deals table and the Marketing_Touches table?”
This proactive step ensures your analysis is built on a solid data foundation.
3. Executing with Control: Stop, Resume, or Adjust on the Fly
You remain in full control even after an analysis begins.
- Stop a Run Mid-Execution: If you realize midway through an execution that the plan was flawed or the results are heading in the wrong direction, you don’t need to wait for it to finish. Simply instruct the system to stop. This saves valuable time and computational resources.

Handle Step Failures Gracefully: Occasionally, a step may fail due to a temporary issue, such as a network error. You have two options:
Resume: Prompt the system to resume from the step that failed. “restart the execution from the step3.” Petavue will resume from that point and continue.
Modify and Re-run: This is a perfect opportunity to correct the plan. You can provide a modified plan and instruct Petavue to re-execute the failed step with the new logic.
4. Verifying Results and Iterating Toward Better Insights
Once an analysis is complete, the next step is to validate the output and decide what to do next.
A. Scrutinizing the Summary and Iterating
These steps focus on validating the logic and refining the analysis based on the high-level output.
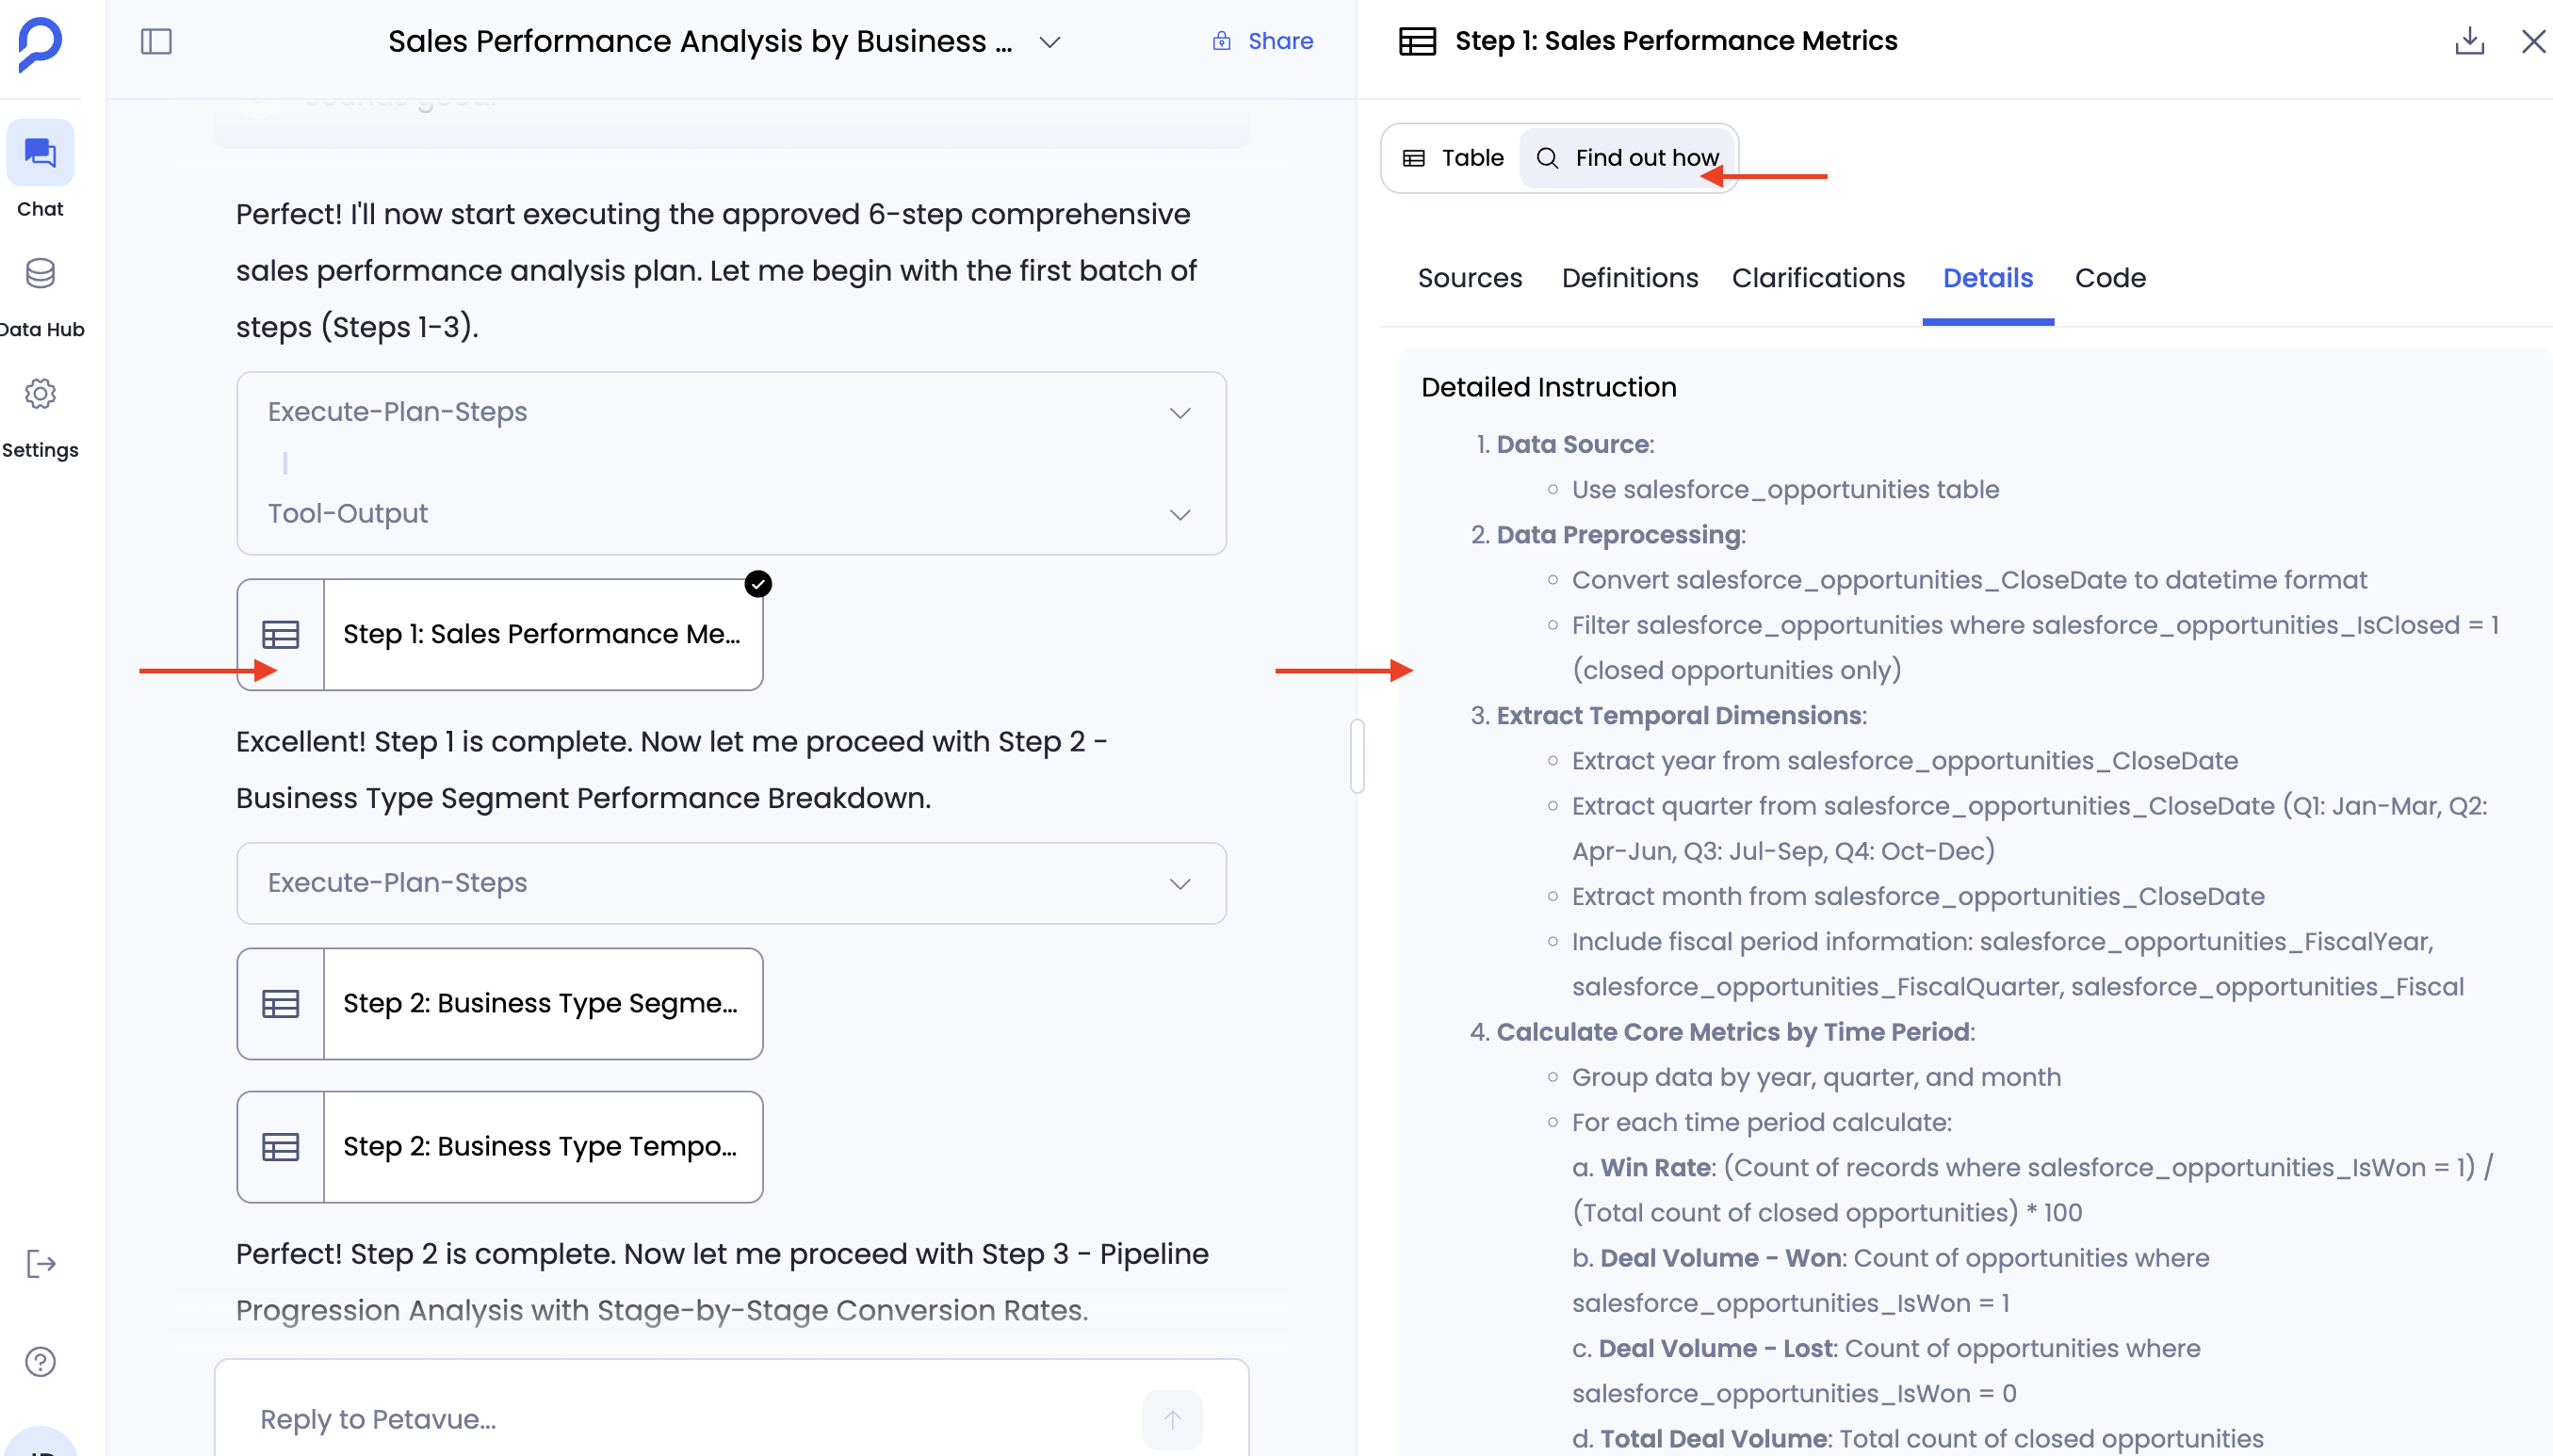
Scrutinize the Summary and Ask “How?”: Read the generated summary carefully. If you’re unclear how a specific insight or recommendation was derived, ask for clarification. Example Prompt: “How did you calculate the win rate in the analysis above? Explain the steps.”
Dive into the Result Tables: For complete transparency, look for the Report or Table link embedded directly within each analysis step in the chat. Clicking this opens a detailed view on the right side of your screen. Here, you can toggle between the data table and the 'Find out how' tab to see the full audit trail, thought process, and code without leaving the chat interface.

- Iterate on Unexpected Results: If the final results are not what you expected, it’s not a dead end. It’s an opportunity for a follow-up. Prompt the system with your observation and provide correctional instructions to redo the analysis. Example Prompt: “The above analysis was not quite right. I expected to see the results grouped by sales rep. Please modify the plan to add that grouping and rerun it.”
B. Prioritizing Full Data Access: The '25-Record Display Rule'
When Petavue finishes the analysis, when you explicitly prompt Petavue to display results in a table format (e.g., "Can you give me the results in table output"), the system prints a subset of the data directly into the chat window for quick reference.
Understand the Chat Limit: For performance and optimization, Petavue limits the table data shown in the main chat UI to the top 25 rows. This display is ideal for quickly verifying high-level results like "Top 5 Deals" or "Bottom 10 Contacts."
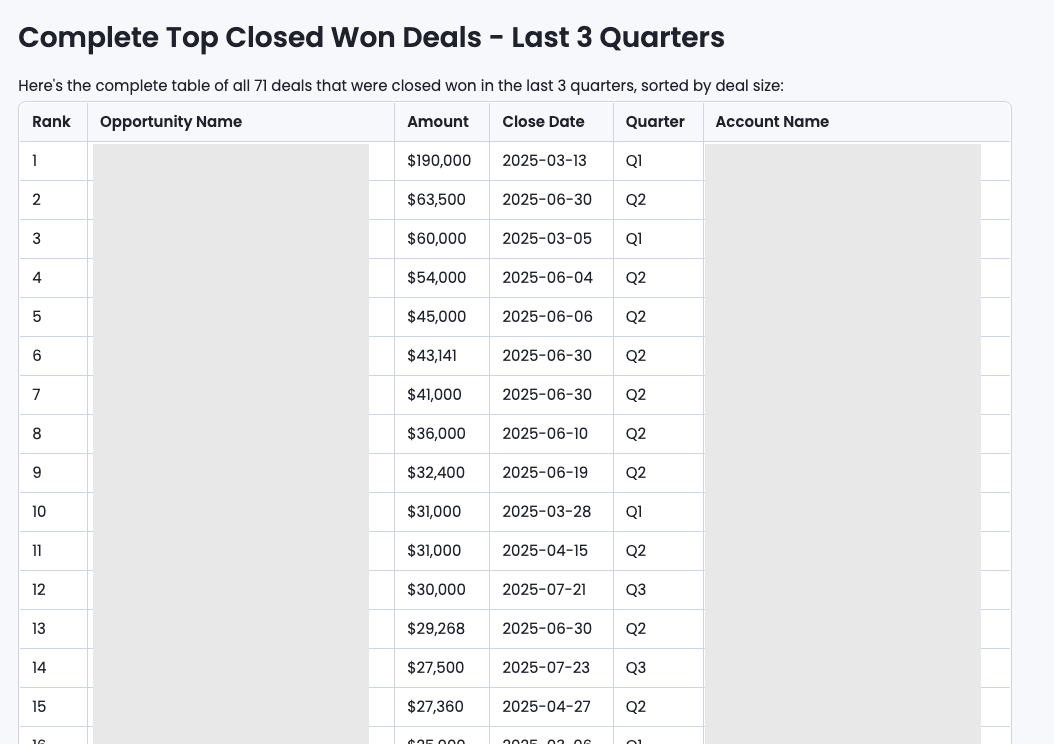

The Critical Best Practice: If you ask the system to include the full data in the chat table output, the conversational orchestrator may generate placeholders or inaccurate data beyond the initial 25 actual records. This happens because the complete dataset is not sent to the orchestrator, and relying on this expanded chat output can lead to misleading insights.
- Recommendation: For viewing the complete, verified, and auditable dataset, always click the Report link located within the specific analysis step. This opens the complete, verified dataset in the right-side panel, ensuring you see the full results while keeping your conversation context visible.
5. Saving Your Logic as Key Definitions (KDs) for Future Consistency
If you find yourself repeatedly defining a specific metric or formula (e.g., "Annual Recurring Revenue" or "Qualified Lead"), save it as a Key Definition (KD). Once you execute an analysis step that calculates a valuable metric, you can instruct the system to save that logic as a KD. This ensures that you and your team use the same formula consistently across all future analyses. Read this help doc for full guidance on understanding and creating KD
6. Managing Long Conversations and Multi-Step Analyses
Managing Longer Conversations Petavue excels at maintaining context. However, for optimal performance and accuracy in very long chats:
Reference by Name: To follow up on an analysis performed many messages ago, refer to it by its name or a key distinguishing feature. Example: “Regarding the ‘Sales Funnel Analysis’ done above, can you now break down Step 2 by region?”
Work Within Recent Context: The system is most effective when following up on analyses done within the last 10 messages. If you need to update a report created earlier, ensure the message creating that report is within this recent window for the best results.
Delete an Irrelevant Message: If you make a mistake or your last prompt is irrelevant, you can use the delete option to remove the last message and keep the conversation clean and focused.
By integrating these best practices into your workflow, you can harness the full power of Petavue, ensuring every analysis is accurate, transparent, and delivers maximum value.
If you have any questions or need further assistance, please don't hesitate to contact our support team at support@petavue.com.