Performing Analysis in Petavue: A Step-by-Step Guide
Why Planning is Central to Data Analysis
Data analysis isn’t a single step; it’s a sequence. Answering something like, “How have sales touches impacted conversions in the last two quarters?” takes preparation, diagnosis, calculation, and interpretation. Each of those steps can introduce risk if they aren’t aligned.
That’s why Petavue takes a plan-first approach. Before a query runs, the system generates a transparent plan — which tables will be used, what filters apply, and how each metric is calculated.
But the real safeguard isn’t just the plan itself, it’s the approval process. By reviewing and validating the plan upfront, you make sure every analysis is accurate, trusted, and aligned with the business question at hand.
This approval step shifts analysis from a black-box exercise to a controlled, auditable workflow; one where results are not only fast, but reliable.
The Petavue Workflow at a Glance
Every analysis in Petavue follows a simple, powerful loop that puts you in control:
Ask a Question: Frame your business question in plain language using defined metrics and terms.
Review the Plan: Petavue generates a detailed plan outlining how it will answer your question.
Modify (If Needed): Adjust tables, metrics, filters, or steps using simple follow-up messages.
Approve Execution: Give the explicit go-ahead to run the analysis. No queries are run without your approval.
Receive Results: Petavue summarizes the findings in plain language, with actionable insights.
- Validate and Report: Dig into details to validate the execution and generate an executive summary.
You can refer to how a full analysis is done in this video:
Let's explore each step in detail.
Step 1: Ask Your Question
Log in to Petavue and open the Chat. This is where every analysis begins. Type your business question in plain language — it can be broad or very specific. Remember: the clearer your question, the more accurate and tailored the plan will be.
For example, let’s try asking:
“How did activities look for deals across different segments that were won or lost in the last 6 months?”
Step 2: Review the Analysis Plan
After you submit a question, Petavue generates an analysis plan. Think of this plan as your blueprint — or even a contract — for how the system will answer your question. It lays out the exact steps, tables, and definitions that will be used before anything is executed.


A plan is formatted for clarity and includes:
Step Number & Name – a label and short description of what this part of the analysis is doing.
Objective – the specific business question or calculation the step addresses.
Requirements – filters, conditions, or assumptions applied (e.g., “last 6 months”).
Relevant Tables – which data sources and joins will be used.
Key Definitions – standardized metrics or glossary terms applied (e.g., how “Win Rate” is defined). Click here to read about Key Definitions.
Best Practice: Carefully review each section of the plan. If a table seems incorrect or a definition is missing, you can correct it in the next step before execution. This proactive review prevents errors and builds trust in the final result.
Step 3: Modify the Plan When Needed
If your analysis is one-and-done, that’s great. However, it’s completely fine to adjust the plan after reviewing it, and Petavue is designed for this iterative process. You can modify the plan at any time by giving feedback in a follow-up message.
A. Update the Plan
In our example scenario above, the plan is set to analyze the impact of activities on deals closed in the last 6 months. Suppose we actually want results for the last 1 year. Simply provide that feedback in your next message, and Petavue will update the filter condition from 6 months to 1 year.

Here are the ways you can update a plan:
Edit existing steps: “In Step 1, change the filter from ‘last 6 months’ to ‘last 1 year’.”
Add new steps: “Add a new step to break down the results by industry.”
Remove unnecessary steps: “Remove Step 3, it’s not relevant.”
Specify columns or tables: “In Step 2, update the column for breakdown to use the segment column from the companies table.”
You can choose to send multiple changes at once in a single message or update step by step across several follow-ups. Both approaches work.
After every update, Petavue will generate a revised plan reflecting your instructions. As with the initial plan, review it carefully each time before approving execution to ensure accuracy.
B. Perform Data Diagnosis to Update the Plan
Sometimes you may be uncertain about a data point in the plan, such as which column is being used for filtering or whether the right condition has been applied. In these cases, it’s a good practice to run a quick data diagnosis before approving execution.
In our analysis here, suppose you want to confirm if the correct segment column is used in the plan and check for its alternates, you can ask:
“What columns are available for segment-related filtering that classify deals or companies by SMB, Midmarket, and Enterprise? Also, how much of the data is actually filled in those columns?”

How Petavue works here:
Petavue will return a result showing the available columns.
It may highlight that, for instance, the Business_Type__c column from the companies table has the highest data fill percentage.
Based on this, Petavue may recommend using that column for analysis.
If the original plan included a different column, you now have the insight to modify the plan accordingly. This step ensures that your analysis is grounded in the most reliable data.
For more details on exploring your data and available columns, click here to learn about Understanding Your Data.
Step 4: Approve and Execute the Plan
No analysis will run until you explicitly approve the plan. Once you are satisfied with the steps, give Petavue the go-ahead to execute.
The go-ahead is conversational again. It can be a simple ‘yes’ or ‘go ahead’ or even an enthusiastic ‘let’s do it!’. We don’t mind at all.
Once the execution begins, Petavue MCP client will call the Execute-Plan-Steps for every step and finish the execution as shown.

What will happen during execution:
- The Petavue MCP Client will automatically call supporting tools when required:
Understand-Data Tool: Used if the system needs to validate details about data and its coverage.
Clarification Tool: Used if a step has multiple possible implementation methods and the system needs to resolve the ambiguity.
Petavue uses the full context of your data and definitions to answer these tool-generated questions on its own.
You can expand the corresponding tool sections to review both the questions and Petavue’s responses if you want visibility.
- These tool calls do not block progress — the system continues execution automatically.
Step 5: Understand the Summarized Results
Once execution is complete, Petavue generates a plain-language summary of the analysis. This is produced by the Summary Tool, and its purpose is to give you an immediate, high-level understanding of what the data reveals.
A typical summary includes:
Key insights: The main findings from the data and what they mean for your business.
Interpretation: Explanations of trends, patterns, or anomalies observed.
Actionable recommendations: Practical next steps you can take based on the results.
Supporting statistics: The core numbers and figures that validate the findings.
This summary allows you to grasp the “story” of your data quickly, before diving into detailed reports or validation.


Step 6: Validate the Execution
Trust and transparency are paramount for every analysis in Petavue. Once you have results, you can always validate how the system produced them.
One way is to ask directly in chat:
“Could you explain how you executed the above analysis?”
When you do this, Petavue calls the Find-Out-How tool, which provides a detailed, step-by-step account of the execution.

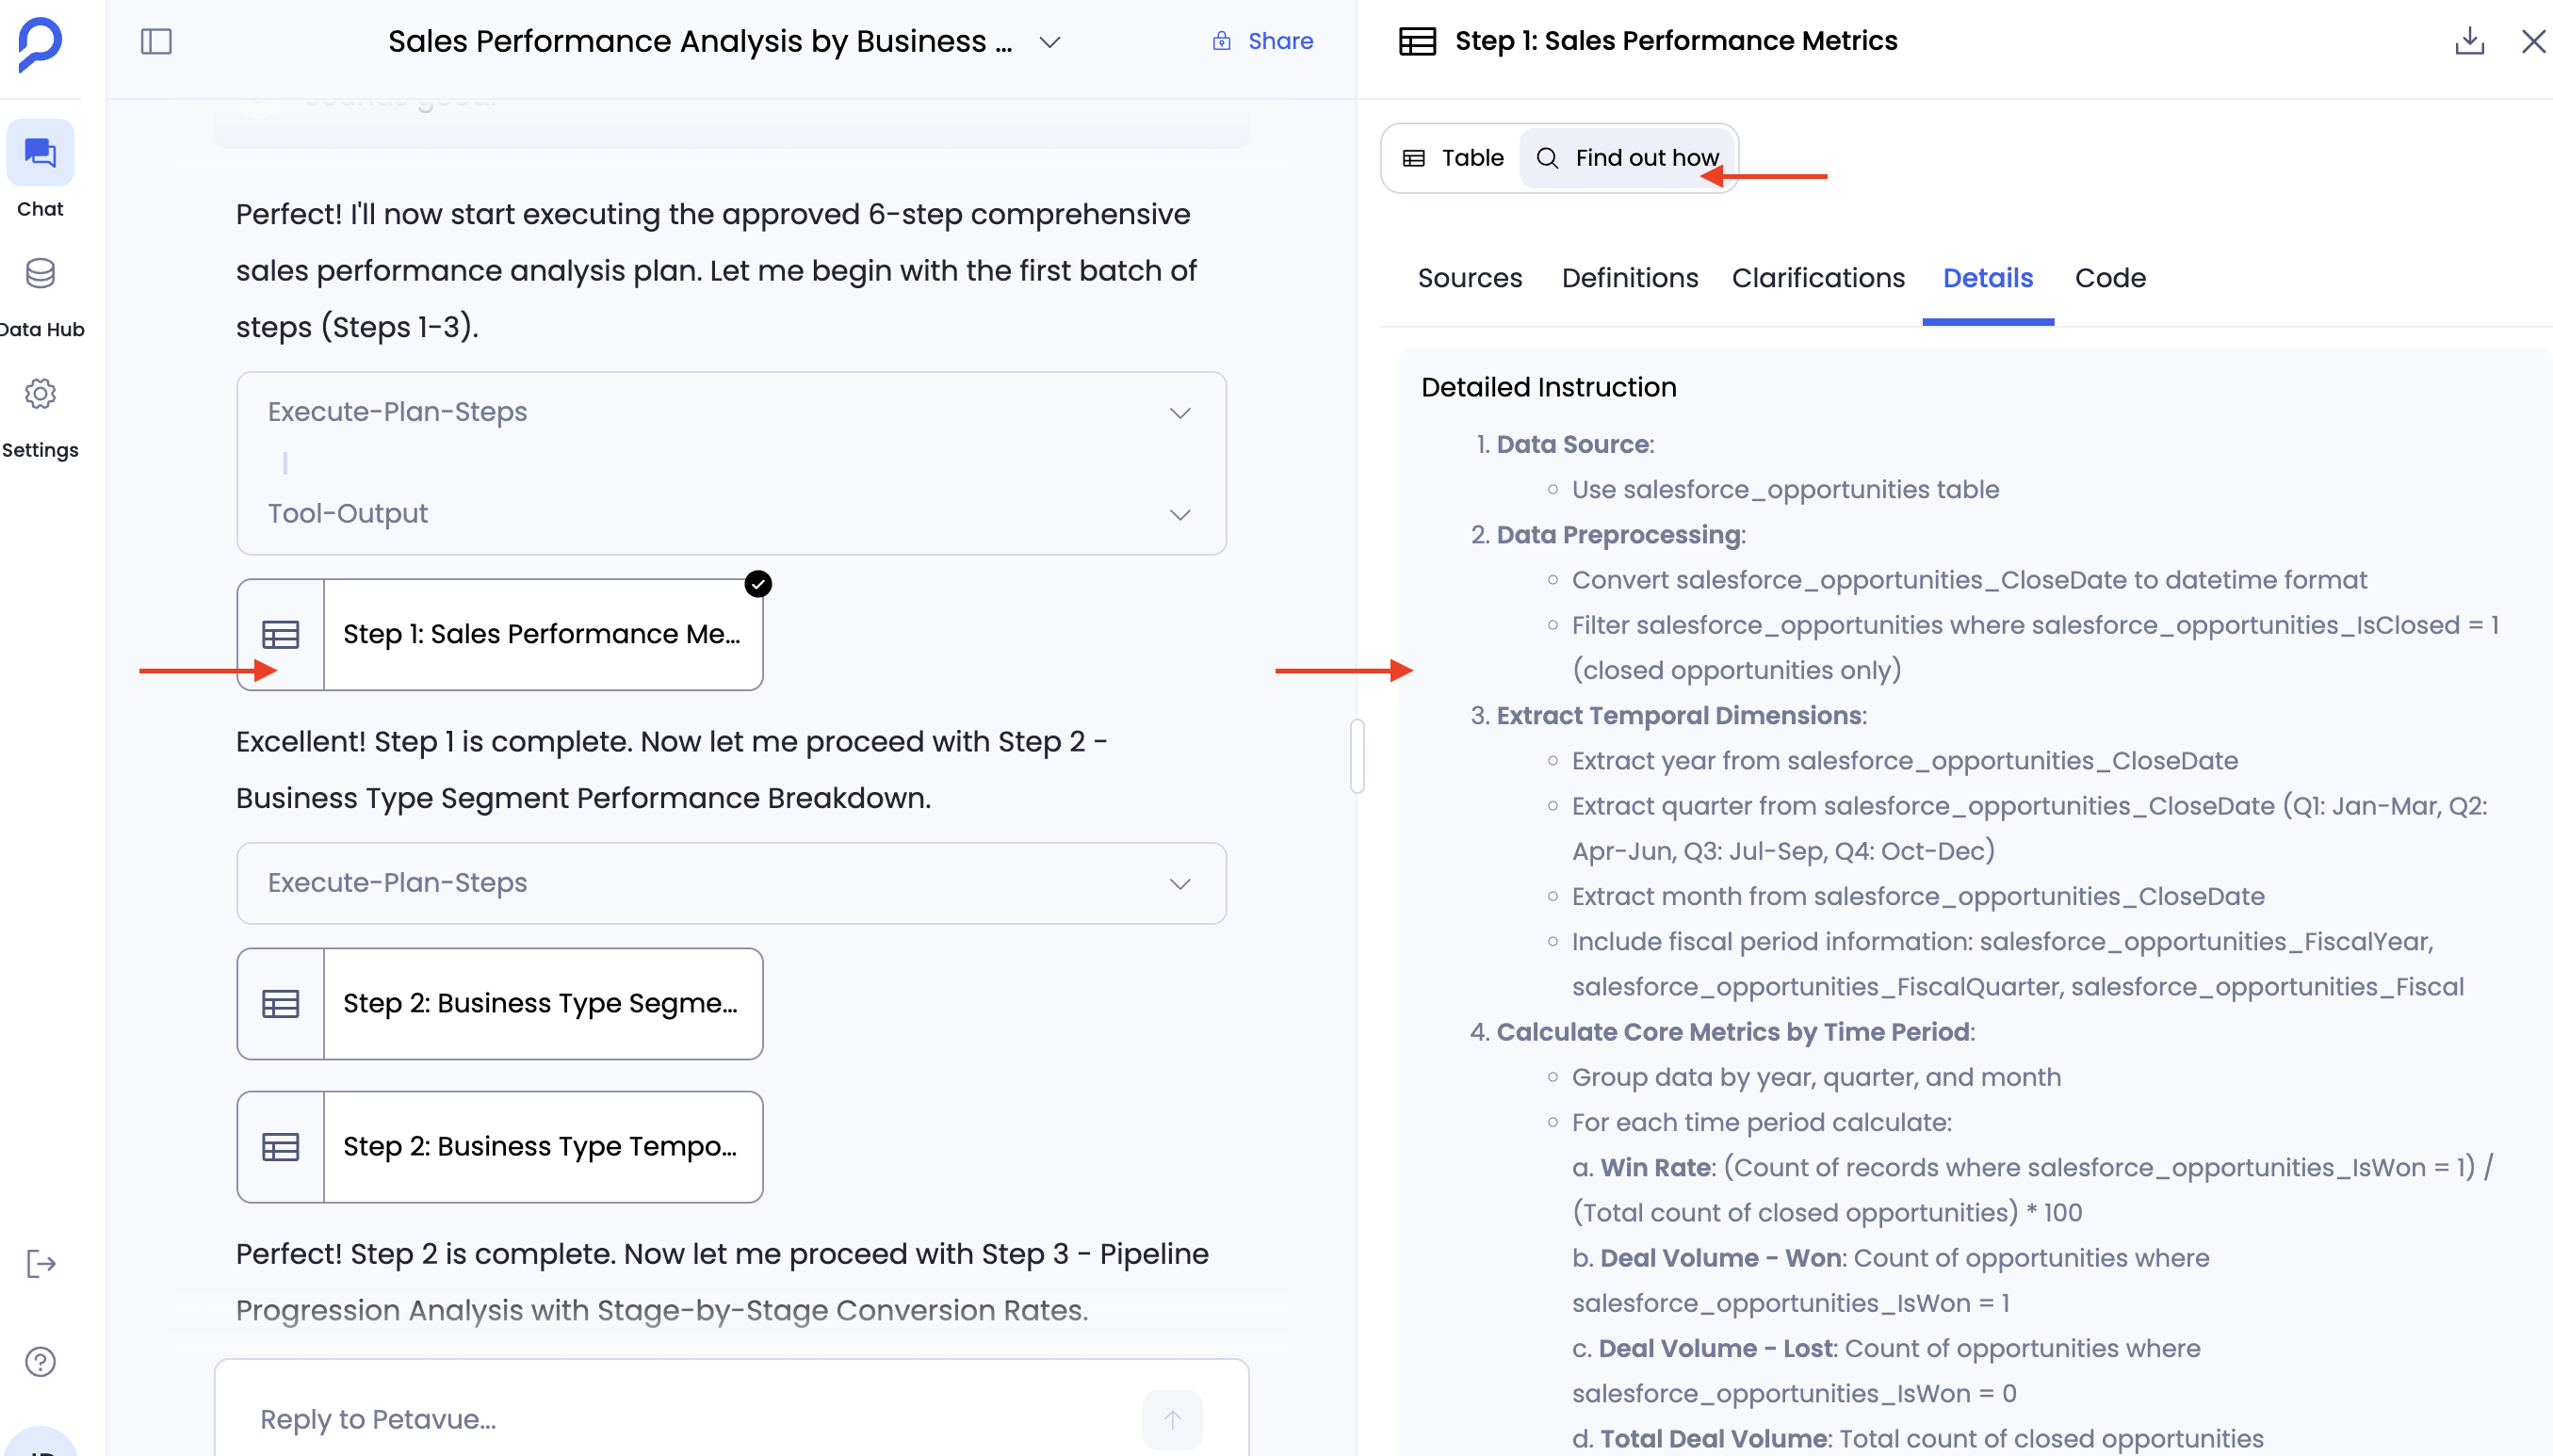
In addition, every individual step in the analysis includes a direct link to its detailed report. Clicking this link opens the Report View on the right side of your screen. This split-screen layout allows you to audit the data and logic while keeping the chat conversation open on the left. In this panel, you will find:
Petavue’s reasoning and thought process.
The exact plan instructions that were executed.
A clear execution summary.
The specific data sources used.
All applied definitions (for example, how “churn” or “pipeline” was calculated).
Reviewing this tab gives you full visibility into the logic behind the output, so you can confirm that the analysis was executed correctly and confidently share results with others.
Step 7: Generate an Executive Summary Report
After you have validated the results, you can request a formal report that captures the analysis in a clear, structured format. Simply prompt:
“Create an executive summary report from this analysis.”
Petavue will generate a clean, well-structured text report on the fly, summarizing the key sections with accurate data, ready for you to share.


You can continue refining your report through follow-up prompts and feedback. Once finalized, you can download the report or share it within your organization for broader visibility.
Step 8: Do a Follow-Up Analysis (Drilldowns & Iterations)
Analysis in Petavue doesn’t have to stop with the first result. You can always ask follow-up questions to dig deeper or extend the analysis.
For example, suppose your initial analysis summarized overall sales activity for won vs. lost deals. Now, you want to break it down by industry:
Prompt: “Break this analysis down by industry.”
Petavue generates a new plan for the breakdown.
Review and approve the plan as usual.
- The system executes and presents results with additional detail by industry.


Adding Follow-Up Results to a Report
If this breakdown is something you want included in your existing executive summary report, simply prompt:
“Add this industry breakdown as a new section in the report we created earlier.”
Petavue will iteratively update the report, layering new insights into the same document. You can repeat this process as many times as needed — each new drilldown or extension can become part of the evolving report.


Best Practice: Use follow-up questions for drilldowns (e.g., by industry, by region, by segment) to progressively refine insights, while keeping all results organized in a single updated report.
Conclusion
Remember, prompting and conversation are the key gateways to getting the best out of Petavue — the more you interact, the more tailored and valuable your analysis becomes.
For deeper guidance, check out Prompting Guidelines.
Please get started analyzing your data in Petavue. If you have questions, feedback, or run into any issues, don’t hesitate to reach out to support@petavue.com. Your input is invaluable in helping us improve your experience.